Hello,
Is there any functionality in ERPNext regarding the debugging at the server side? (Same as like Odoo)
If I want to show the background processes at the server side then the debugging is very useful.
So, I just want to know that.
Thank You.
Hello,
Is there any functionality in ERPNext regarding the debugging at the server side? (Same as like Odoo)
If I want to show the background processes at the server side then the debugging is very useful.
So, I just want to know that.
Thank You.
There are lots of differ log files:
home/erpnext/frappe-bench/logs/
And in frappe directory.
May this help.
Hopefully this blog will help.
Yeah!
That article covers all the basic stuff, right up to mentioning debugging Frappe/ERPNext server-side source code … then swerves back into basic stuff. Really great! ![]()
I need to understand a piece of deep guts ERPNext code that seems to be misbehaving:
I really did not want to do that with dozens of inserted print statements.
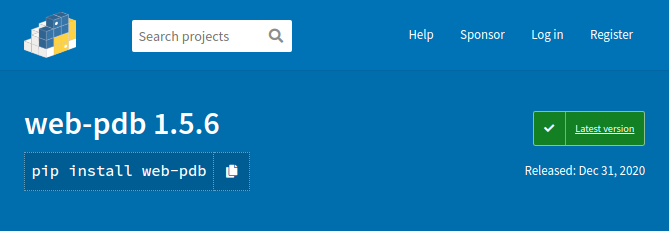
Here’s how I got started with Web-PDB …

pdb is the Python debugging tool.
It’s a powerful command line tool, but I was looking for something a little closer in functionality to Chrome Dev-Tools.
web-pdb does not come anywhere close to dev-tools, but it is a step up from pdb.
The first step is to add the web-pdb package to your bench environment.
Here’s the wrong way to do it.
pip install web-pdb
The the right way is to append web-pdb to the file requirements.txt which lives in the root directory of every Frappe app. You then execute: bench setup requirements.
erpdev@fossa:~/frappe-bench-DENH$
erpdev@fossa:~/frappe-bench-DENH$ tail -n 4 apps/erpnext/requirements.txt
Unidecode==1.1.1
WooCommerce==2.1.1
pycryptodome==3.9.8
web-pdb==1.5.6
erpdev@fossa:~/frappe-bench-DENH$
erpdev@fossa:~/frappe-bench-DENH$
erpdev@fossa:~/frappe-bench-DENH$ bench setup requirements
Installing applications...
$ ./env/bin/pip install -q -U pip

Installing frappe
$ ./env/bin/pip install -q -U -e ./apps/frappe
$ yarn install
yarn install v1.22.5
[1/4] Resolving packages...
success Already up-to-date.
$ yarn run snyk-protect
yarn run v1.22.5
$ snyk protect
Successfully applied Snyk patches

Done in 34.09s.
Done in 35.19s.

Installing erpnext
$ ./env/bin/pip install -q -U -e ./apps/erpnext
$ yarn install
yarn install v1.22.5
[1/4] Resolving packages...
success Already up-to-date.
$ yarn run snyk-protect
yarn run v1.22.5
$ snyk protect
Successfully applied Snyk patches

Done in 3.50s.
Done in 4.07s.

erpdev@fossa:~/frappe-bench-DENH$
I generally also flush the toilets with clear-cache and migrate. They seem to work like a sort of digital garlic, claimed as a panacea for all sorts of ERPNext ills, and seemingly harmless, so I just call them whenever I’ve been hacking around inside or simply things get a little blue around the gills.
erpdev@fossa:~/frappe-bench-DENH$
erpdev@fossa:~/frappe-bench-DENH$ bench --site dev.erpnext.host clear-cache
erpdev@fossa:~/frappe-bench-DENH$
erpdev@fossa:~/frappe-bench-DENH$
erpdev@fossa:~/frappe-bench-DENH$ bench --site dev.erpnext.host migrate
Migrating dev.erpnext.host
Updating DocTypes for frappe        : [========================================] 100%
Updating DocTypes for erpnext       : [========================================] 100%
Updating Dashboard for frappe
Updating Dashboard for erpnext
Updating customizations for Address
Updating customizations for Contact
Building search index for dev.erpnext.host
erpdev@fossa:~/frappe-bench-DENH$
erpdev@fossa:~/frappe-bench-DENH$
The goal is to track down how and why the basic_rate value in a Stock Entry from a Work Order from a Bill of Materials is wrong. So, having decided on a likely suspect bit of code, we insert web_pdb.set_trace():
# Copyright (c) 2015, Frappe Technologies Pvt. Ltd. and Contributors
# License: GNU General Public License v3. See license.txt

from __future__ import unicode_literals
import frappe
import json

import web_pdb #  <=======  YOO! HOO!  It's me.  Right here! See!

           :           :           :           :           :

	def set_basic_rate(self, reset_outgoing_rate=True, raise_error_if_no_rate=True):
		"""
			Set rate for outgoing, scrapped and finished items
		"""

		web_pdb.set_trace() #  <=======  ... and me again right HERE!!!

		outgoing_items_cost = self.set_rate_for_outgoing_items(reset_outgoing_rate)
		finished_item_qty = sum([d.transfer_qty for d in self.items if d.is_finished_item])

		# Set basic rate for incoming items
		for d in self.get('items'):
			if d.s_warehouse or d.set_basic_rate_manually: continue
The next step is to restart the bench. You don’t want the Supervisor running for this because you will lose visibility on a lot of valuable logging information. So do:
erpdev@fossa:~/frappe-bench-DENH$
erpdev@fossa:~/frappe-bench-DENH$ sudo supervisorctl stop all
frappe-bench-DENH-einvoice_svc: stopped
frappe-bench-DENH-redis:frappe-bench-DENH-redis-cache: stopped
frappe-bench-DENH-redis:frappe-bench-DENH-redis-queue: stopped
frappe-bench-DENH-web:frappe-bench-DENH-node-socketio: stopped
frappe-bench-DENH-workers:frappe-bench-DENH-frappe-schedule: stopped
frappe-bench-DENH-redis:frappe-bench-DENH-redis-socketio: stopped
frappe-bench-DENH-workers:frappe-bench-DENH-frappe-long-worker-0: stopped
frappe-bench-DENH-workers:frappe-bench-DENH-frappe-default-worker-0: stopped
frappe-bench-DENH-workers:frappe-bench-DENH-frappe-short-worker-0: stopped
frappe-bench-DENH-web:frappe-bench-DENH-frappe-web: stopped
erpdev@fossa:~/frappe-bench-DENH$
erpdev@fossa:~/frappe-bench-DENH$
erpdev@fossa:~/frappe-bench-DENH$
erpdev@fossa:~/frappe-bench-DENH$ bench start
17:59:52 system           | redis_queue.1 started (pid=8482)
17:59:52 redis_queue.1    | 8495:C 15 Jan 2021 17:59:52.054 # oO0OoO0OoO0Oo Redis is starting oO0OoO0OoO0Oo
17:59:52 redis_queue.1    | 8495:C 15 Jan 2021 17:59:52.054 # Redis version=5.0.7, bits=64, commit=00000000, modified=0, pid=8495, just started
17:59:52 redis_queue.1    | 8495:C 15 Jan 2021 17:59:52.054 # Configuration loaded
17:59:52 redis_queue.1    | 8495:M 15 Jan 2021 17:59:52.054 * Increased maximum number of open files to 10032 (it was originally set to 1024).
17:59:52 redis_queue.1    | 8495:M 15 Jan 2021 17:59:52.055 * Running mode=standalone, port=11000.

            "            "            "            "            "
blabbity-blabbity-blah
            "            "            "            "            "

18:00:36 watch.1          | Rebuilding marketplace.min.js
18:00:40 watch.1          | Rebuilding erpnext.min.js
18:00:41 watch.1          | Rebuilding item-dashboard.min.js
There are (at least) two certain obstacles to seeing this work properly.
httpBy default web-pdb receives connections on port 5555.
Like every un-opinionated very stable genius, I run ERPNext on an Ubuntu server, so I just have to do:
erpdev@fossa:~/frappe-bench-DENH$ sudo ufw allow 5555
Rule added
Rule added (v6)
erpdev@fossa:~/frappe-bench-DENH$
As an extra step, you can dig into NGinx and have it expose port 5555 as an SSL port in order to be able to access the debugger with a modern browser that automatically redirects to HTTPS. Have fun!
There’s an easier way in Chrome. Open the link:
chrome://net-internals/#hsts
Scroll right down to the bottom, stuff your server URL into the “Domain” field of “Delete domain security policies” and click on the [Delete] button

From then on, Chrome will permit plain old HTTP access to that address.
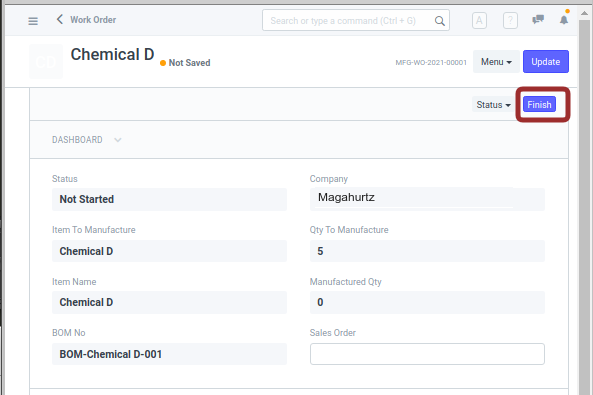
The next step is to generate the Stock Entry by Finishing the Work Order:

When you do that, Python code on the server for the Work Order will call into the Stock Entry DocType. Part way through it will hit the web-pdb code we inserted. Your ERPNext browser page is likely to start whining and bitching about server errors and time outs, but you don’t care about that right now.
In your bench terminal session you will see:
19:08:02 web.1            | 127.0.0.1 - - [15/Jan/2021 19:08:02] "GET /api/method/frappe.desk.form.load.getdoc?doctype=Work+Order&name=MFG-WO-2021-00001&_=1610755656127 HTTP/1.0" 200 -
19:08:03 web.1            | 127.0.0.1 - - [15/Jan/2021 19:08:03] "POST /api/method/frappe.deferred_insert.deferred_insert HTTP/1.0" 200 -
19:08:03 web.1            | 127.0.0.1 - - [15/Jan/2021 19:08:03] "GET /api/method/frappe.desk.notifications.get_open_count?doctype=Work+Order&name=MFG-WO-2021-00001&items=%5B%22Stock+Entry%22%2C%22Job+Card%22%2C%22Pick+List%22%5D&_=1610755656128 HTTP/1.0" 200 -
19:08:32 web.1            | CRITICAL:root:Web-PDB: starting web-server on fossa:5555...
The last line shows that you can now open the debugger in your browser:
In the command line at the very bottom you can enter ad hoc Python3 commands to examine the data involved in the function you are examining. You set break points by clicking code line numbers and you can use the buttons to step through the code in various ways.
Best of all : inspect !!!
Here below you can see I can examine every attribute a one of the Item docs just by typing …
inspect d
This is the most important part every ERPNext dev needs to know. ![]()
Another pretty comfortable way of debugging is to use VS Code’s debugger via SSH. You don’t even need to touch the code. Here are some docs on how to get it running.
For someone who has zero experience with Visual Studio there’s a lot of preparatory work to get to the point of using the SSH debugger, right?
Or am I wrong?
I used to use Eclipse for J2EE and remember seeing a significant part of my day, every day, dedicated to tweaking and fiddling with it.
Now my toolkit is pretty much just Sublime Text, Postman & Chrome DevTools.
It surely takes some time to get up and running, like any technology that you’re not used to. ![]()
I highly recommend this instead of changing code directly on a server and exposing your server through the browser.
@MartinHBramwell the way the VSCode’s SSH Remote feature works is that VSCode will connect to the server over SSH and it will work as if you were using VSCode on that server directly. This allows you to securely connect to the server and run whatever you want.
But honestly, I would avoid debugging on a live server in the first place. That’s just bad practice. Take a database dump and load it in a local environment which is as close to production as possible.
Thanks for the tips!
Our “live server” right now is a snapshotable VPS in the public cloud somewhere where we can all try things out and revert to earlier snapshots each time we think we’ve broken something.
So your advice is sound but our setup is not what you thought.
We spent a lot of time brushing through all the articles we can find on VSC, PyCharm, and all just won’t work.
But yours worked, after 1st attempt! Amazing!
… and a year later! ![]()
And another year later. ![]()
Your web-pdb suggestion is much easier to get up and running, Martin.
Getting ERPNext & VSCode cooperating is extremely frustrating. It drives me crazy.