Script report as rows instead of columns

I have a script report that returns a series of totals for a VAT report summary. I would like to have these displayed as rows with a column with the name and a column with the value. Something along the lines of:

What would be the best way to do this?

Hi!

You need to setup two colums for example:

colums = [
    {
        "fieldname": "vat_type",
        "label": "Vat Type",
        "fieldtype": "Data",
        "width": 200
    },
    {
        "fieldname": "value",
        "label": "Value",
        "fieldtype": "Data",
        "width": 200
    }
]

And for the data add the number of rows do you need, for example:

data = [
    {'vat_type': 'Box 01 Vat Due in this Period', 'value': vat_box_due_in_period},
    {'vat_type': 'VAT due in this period on acq', 'value': vat_due_period_acq},
    ...
]

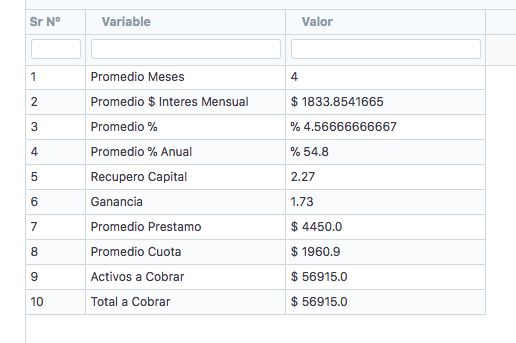
And you get something like this:

11

3 Likes

Hi @federico_calvo, how can we do transpose of this table? i need heading columns in row wise and values should be in column wise.

Regards
Nivedha

Anyone can help me to sort out this