Hi all,
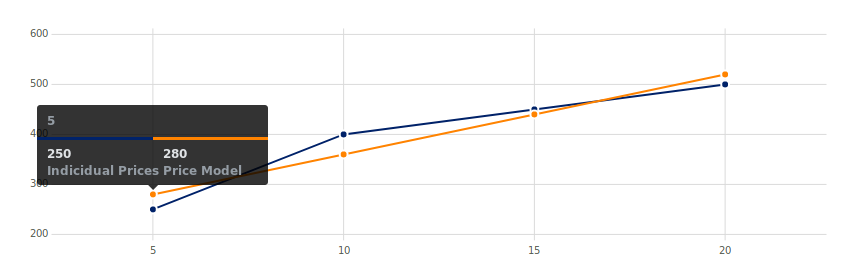
a question on the powerful Frappe Charts: how can axis labels be added? For example in this price model
It should say “Pcs” on the x-axis and “Total price” on the y-axis. I did not find any clues in the docs
https://support.erpnext.com/charts/docs/reference/configuration nor
Frappe Charts: Simple and Modern SVG Charts
Or is this feature missing?
Thanks in advance!
@lasalesi, could you share how you made your y-axis start at 200?
Still trying to figure that one out?
Thank you.
That has been a while  I think it is dynamic depending on the data range. The above code is from
Maybe that helps?