I’m trying to define a chart for a report and it’s working everything except for the Tooltips, can anyone indicate how to use the Tooltips for the reports code?
My chart code inside the “report”.py file:
chart = {
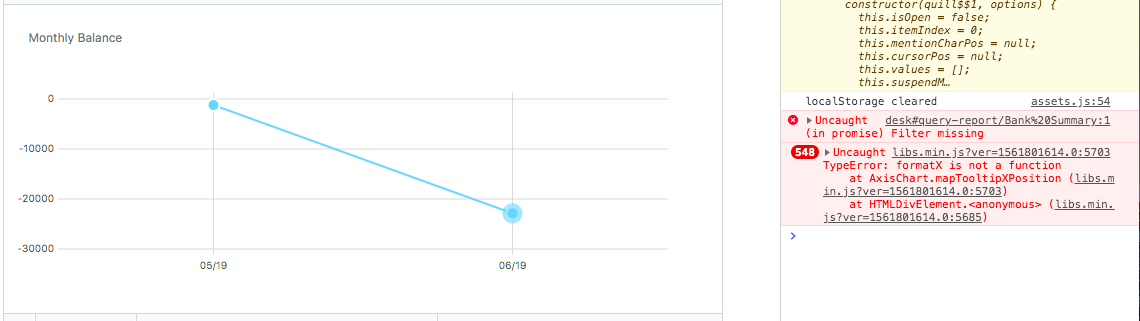
'title': _("Monthly Balance"),
'data': {
'labels': [item[0] for item in sorted_chart_data],
'datasets': [
{'name': _("Balance"), 'values': [item[1] for item in sorted_chart_data]}
]
},
'chart_type': "line",
'lineOptions': {
'dotSize': 6,
},
'isNavigable': True,
'tooltipOptions': {
'formatTooltipX': "d => print_currency(d)",
'formatTooltipY': "d => print_currency(d)"
}
}
“print_currency” function defined in the “report”.js file as follows:
function print_currency(value) {
	return value + " test"
}
Result: