Hi,
Is there a way to add charts in Frappe Dialog components.
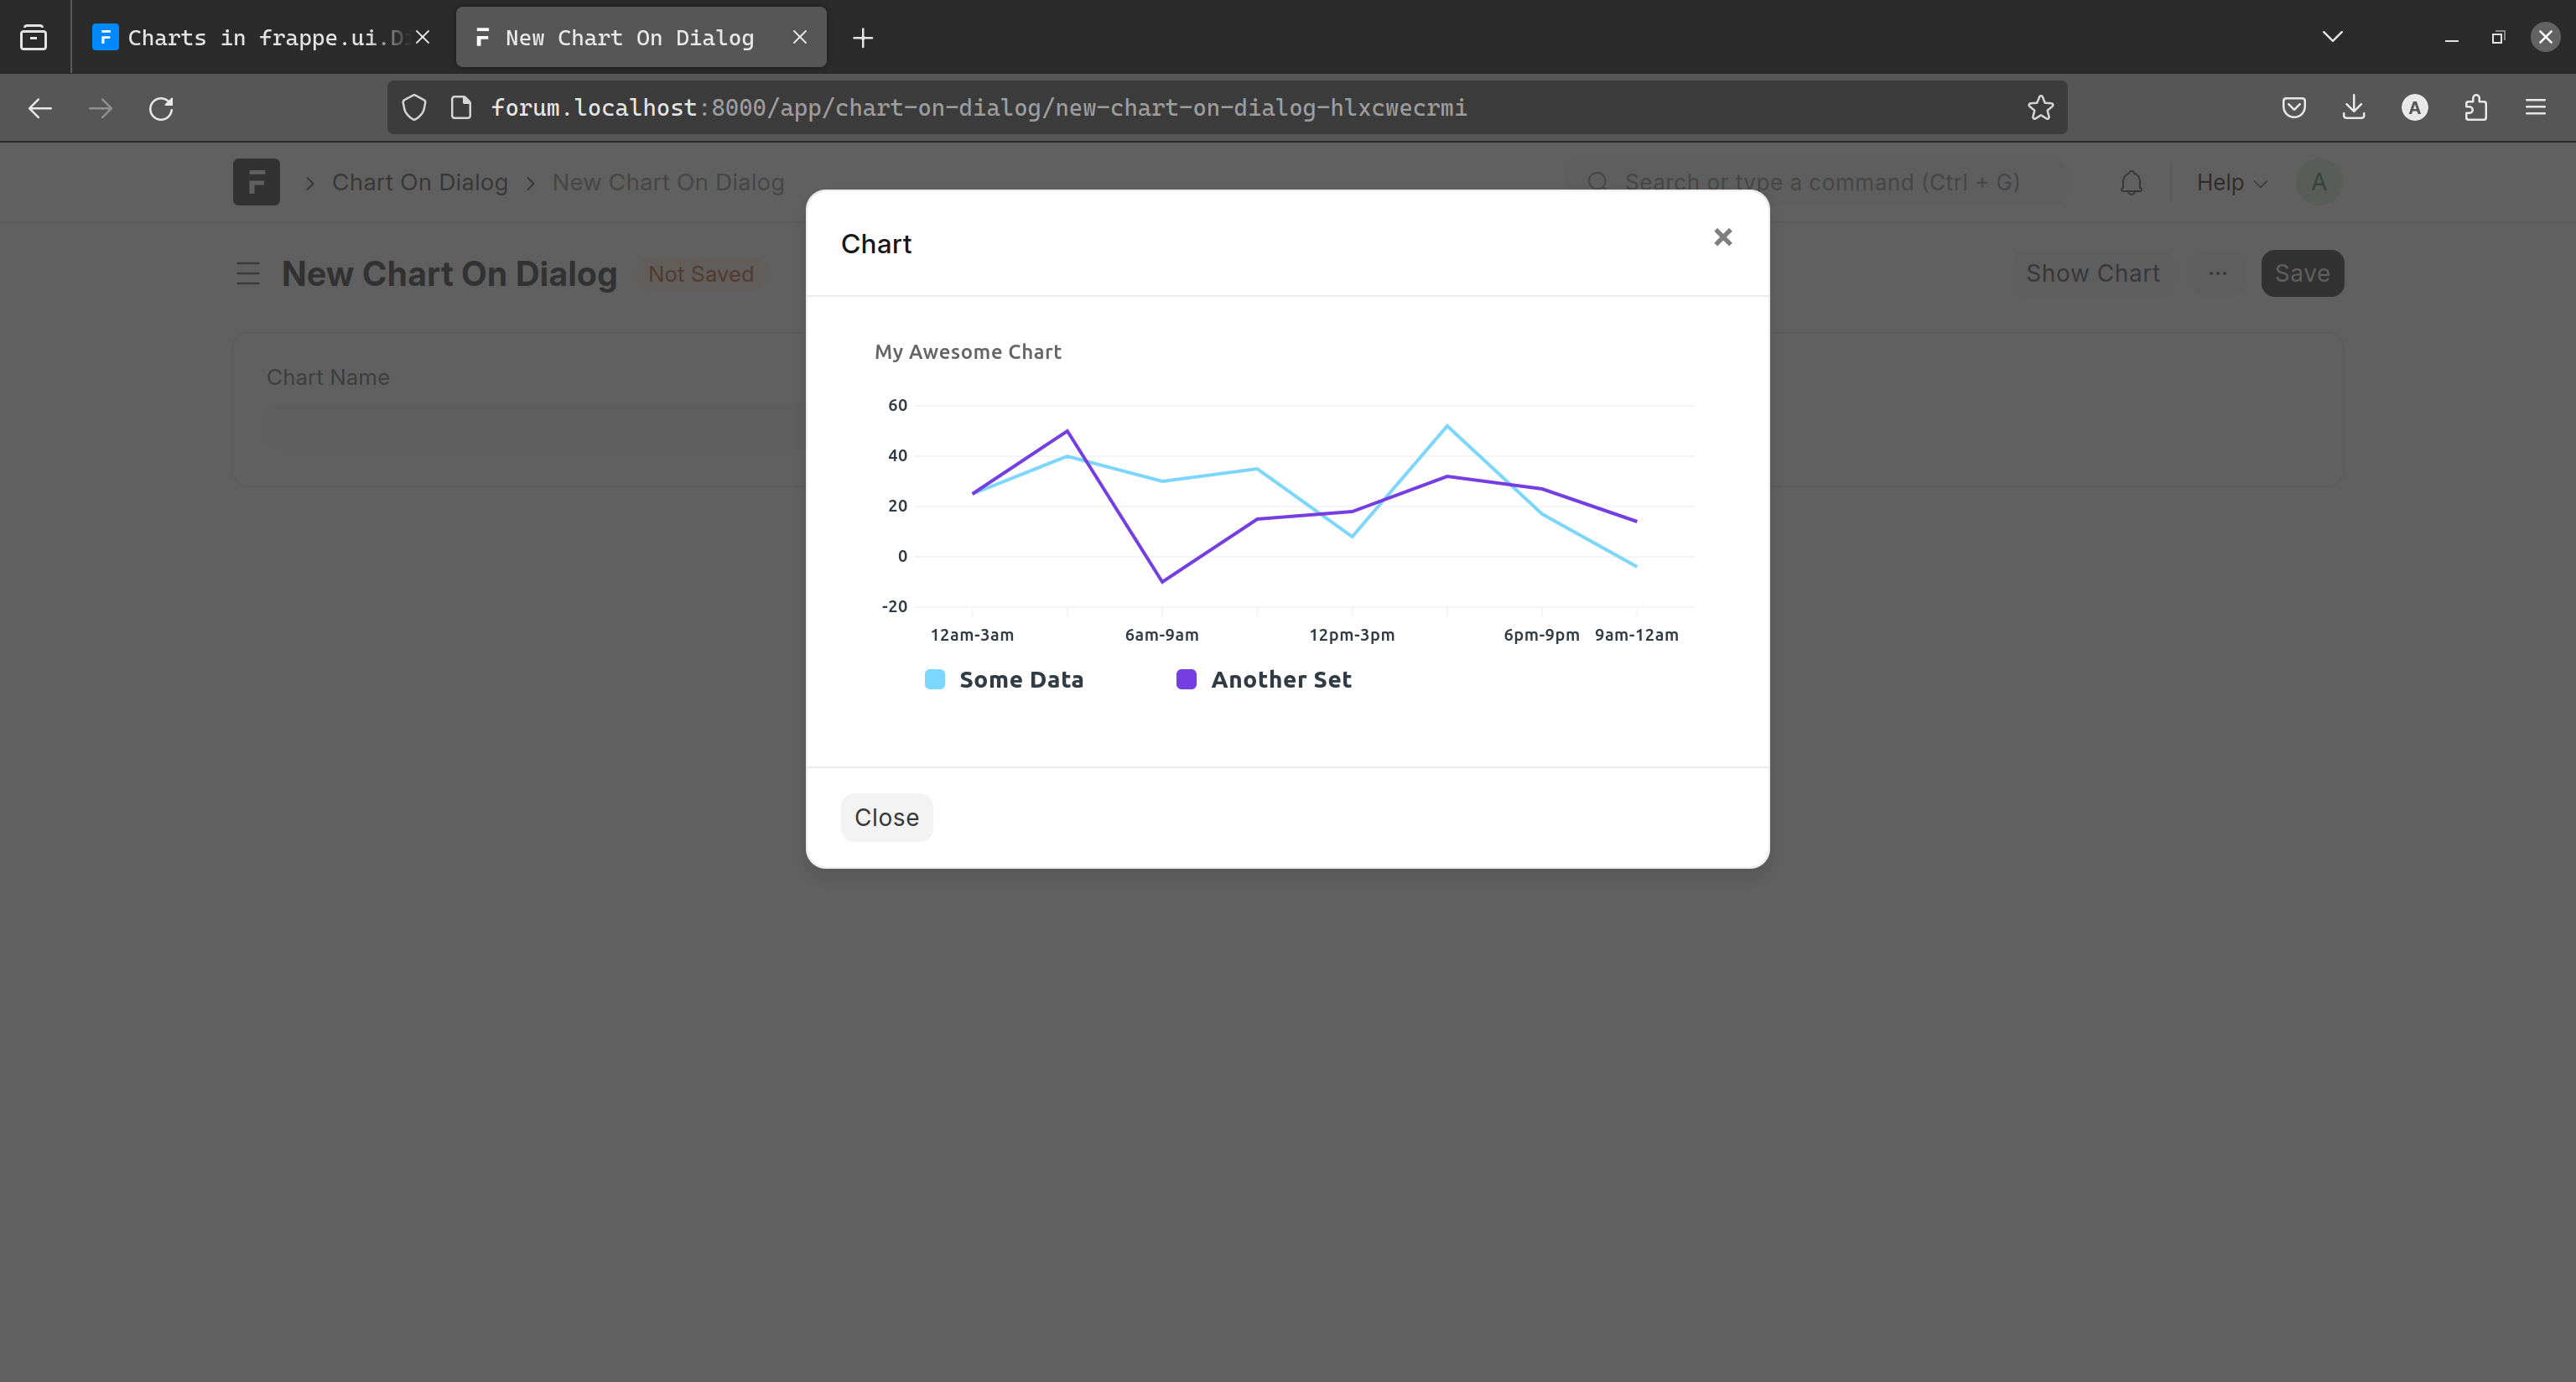
Yes, can you share the code for this.
Note : This is not optimized and well written!! It is just an one way.
frappe.ui.form.on("Chart On Dialog", {
onload(frm) {
const MODAL_HTML = `
<div class="modal fade" id="chartModal" tabindex="-1" role="dialog" aria-labelledby="chartModalLabel" aria-hidden="true">
<div class="modal-dialog" role="document">
<div class="modal-content">
<div class="modal-header">
<h5 class="modal-title" id="chartModalLabel">Chart</h5>
<button type="button" class="close" data-dismiss="modal" aria-label="Close">
<span aria-hidden="true">×</span>
</button>
</div>
<div class="modal-body">
<div id="sample-chart">
</div>
</div>
<div class="modal-footer">
<button type="button" class="btn btn-secondary" data-dismiss="modal">Close</button>
</div>
</div>
</div>
</div>`;
frm.$wrapper.append(MODAL_HTML);
},
refresh(frm) {
frm.add_custom_button(__('Show Chart'), function () {
frm.$wrapper.find("#chartModal").modal('show');
// creating a chart
frappe.utils.make_chart(frm.$wrapper.find("#chartModal").find("#sample-chart")[0], get_chart_option());
});
},
});
function get_chart_option() {
const data = {
labels: ["12am-3am", "3am-6pm", "6am-9am", "9am-12am",
"12pm-3pm", "3pm-6pm", "6pm-9pm", "9am-12am"
],
datasets: [
{
name: "Some Data", type: "bar",
values: [25, 40, 30, 35, 8, 52, 17, -4]
},
{
name: "Another Set", type: "line",
values: [25, 50, -10, 15, 18, 32, 27, 14]
}
]
}
const option = {
title: "My Awesome Chart",
data: data,
type: 'axis-mixed', // or 'bar', 'line', 'scatter', 'pie', 'percentage'
height: 250,
colors: ['#7cd6fd', '#743ee2']
}
return option;
}