Hi i want to know how to set couple axis Oy, left for line, right for bar chart. Please help me if you know. This is my code:
new frappe.Chart(chartContainer, {
data: {
labels: labels,
datasets: [
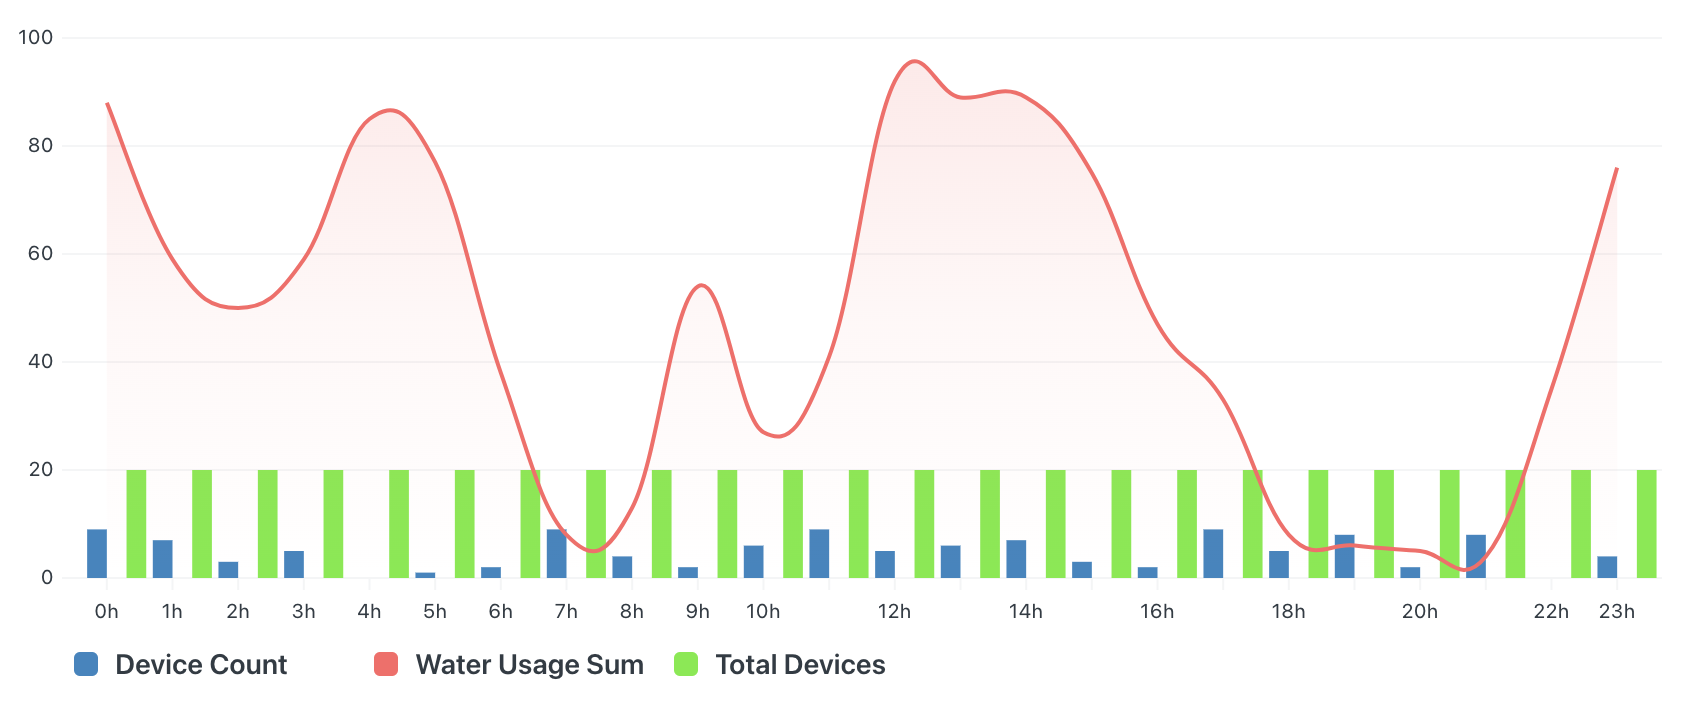
{ name: "Device Count", chartType: "bar", values: deviceCount },
{ name: "Water Usage Sum", chartType: "line", values: waterUsage },
{ name: "Total Devices", chartType: "bar", values: totalDevices }
],
},
title: "Hourly Water Usage and Device Count",
type: "axis-mixed",
height: 400,
lineOptions: { spline: 1, hideDots: 1, regionFill: 1 },
colors: ["#2e86c1", "#ff6666", "#68eb34"],
axisOptions: { xAxisMode: "tick", xIsSeries: true, yAxisMode: "span" },
barOptions: { stacked: 0, spaceRatio: 0.4 },
tooltipOptions: { formatTooltipX: (d) => d, formatTooltipY: (d) => d + " units" },
});