Hi John,
I don’t have easy solutions to offer. But I’ll share some info and advice.
Unlike other ERPs I’ve worked in, ERPNext’s accounting reports are not very “configurable”. There’s no place to specify exactly how your Profit and Loss Statement should look and work. For example, which GL accounts to include/exclude, show in another section, combine with other accounts, etc.
Instead, the P&L Statement Report in ERPNext follows the Chart of Accounts structure rather precisely. To move things around the report, you probably must modify the COA. However, if you modify the COA…that could change how the ERP behaves in terms of validation and posting! 
Next challenge: The P&L statement is one of the more complex reports in ERPNext. It’s a “Script Report”, and has quite a lot of Python code behind it.
If you haven’t found it already, the path to the P&L Script Report’s code is here.
However, during execution, that code in turn calls other code. Which is very relevant to the report’s output. There’s a lot going on, and plenty of Python to decipher, to understand how it all works. 
Options I can think of:
Option 1. Attempt to modify the report’s Python code.
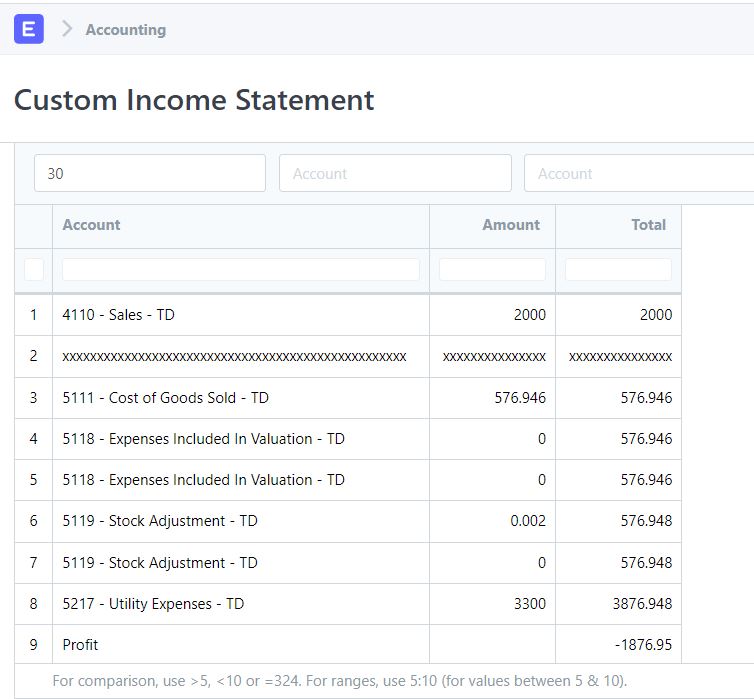
Tricky stuff. You possibly only need to add a line or two of Python, filtering out Account 5118. But like a lot of hacking, sometimes the challenge isn’t knowing what code to write. But where to write it. In other words, you need to hide 5118 carefully, so that P&L totals and roll-ups are accurate when you’re done.
The question of whether to touch/not-touch core code is worth another thread/discussion. But most likely, you probably want to -copy- the standard script report, and make your own, cloned version. That way you don’t have to worry about maintaining a fork.
If you’ve never created your own Script Report before? Well, this is probably one of the worst ones to learn from, because it’s complex.  . I recommend you experiment with something easier, to help you learn them.
Option 2. Write your own version using a Query Report.
One of the reasons the Profit and Loss Statement has so much Python code? Because it’s a “one-size-fits-all” report solution. It has filters for Finance Books, Projects, Cost Centers, Year vs. Month vs. Quarter, currency, etc. It’s a lot to handle.
Your own business may not need all those options. Or at least not simultaneously. If you take them away, and focus on P&L fundamentals, the data and logic behind the report becomes much simpler to grasp and manipulate.
So simple, in fact, that you can probably create your own Query Report that produces the same results. But enables you to more-easily filter out particular accounts, or move things around.
Query Reports rely on writing SQL queries. A P&L Statement requires only a few Tables. At a minimum:
- General Ledger activity:
'tabGL Entry'
- Chart of Accounts structure:
'tabAccount'
If you’re proficient with SQL, you could construct your own query that produces P&L data. Then display that in ERPNext through the Query Report. You could think about using SQL Common Table Expressions to handle the hierarchy. Or just create a bunch of SQL queries and UNION them together. There are tons of possibilities.
Advantage: You haven’t changed a single line of ERPNext code. And you can make the P&L statement look exactly how you want.
Disadvantage: Reinventing the wheel, from a certain point of view. Requires SQL expertise.
Option 3. Excel or Google Docs spreadsheet.
All your General Ledger activity resides in SQL table 'tabGL Entry'. If you’re a spreadsheet guru, you could construct your P&L report as a spreadsheet. Put the results on Worksheet 1, the logic in Worksheet 2, and the raw GL data in Worksheet 3. Just dump your GL data out of ERPNext into your spreadsheet, and refresh.
Also, this may be nice for your Accountants:
- Most are comfortable working in spreadsheets.
- Many enjoy having direct access to the data, to munge it, handle exceptions, re-group data, etc.
Are your accountants ultimately taking the ERPNext P&L report, and just exporting to Excel anyway? If so, you could skip a step. By creating the P&L report as Excel in the first place.
You might encounter issues with size and volume. Importing hundreds of thousands of GL transactions into a spreadsheet is not ideal. But people do this all the time. I’m not a huge fan of Excel, personally. Yet sometimes it’s the path of least resistance.
Option 4. Third Party Software.
This is a much longer-term idea and solution. But since we’re talking about reporting, here’s my take on this:
In many ways, ERPNext is a generalist. A “jack of all trades”. It’s good at many tasks. But not necessarily “great”.
To really get the most value from your data, I would consider using specialty reporting tools. Whether something like Microsoft Power BI, or Solver’s financial reporting tools. Or one of hundreds of other possibilities. But there are definitely Reporting Tools that focus on just that: reporting. Or even Reporting Tools that focus on Financial Reporting.
You can find things with drag & drop widgets, built-in data mining and trend analysis, and so much more.
I am -not- suggesting you reach for this option today. Sounds like you just need a quick fix. But if your career involves working with ERP’s long term? Definitely something to think about.
Hope some of the info above helps. You’re doing well; keep it up! As someone who “started at the bottom” with ERPNext, and learned most of its technology from scratch, I definitely empathize with you. 
~Brian

