Hi,
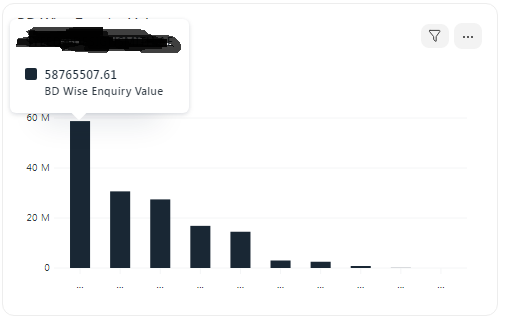
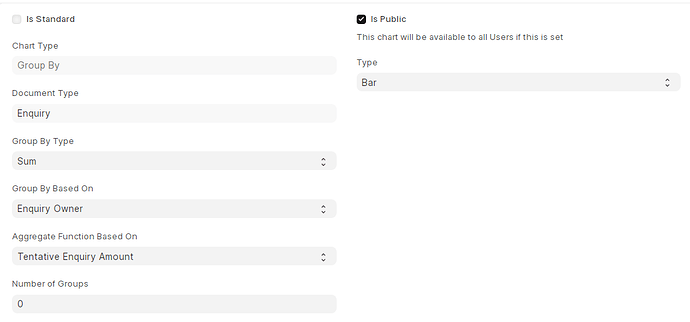
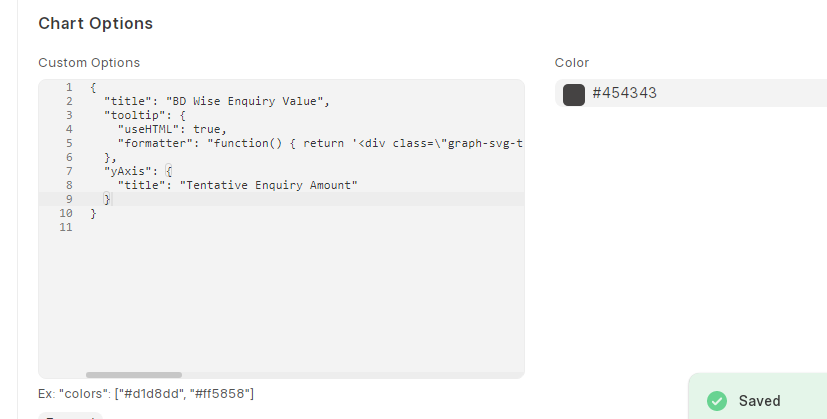
In the dashboard chart, i done bar chart by using Sum. The values showing like 20000.00 instead of 20,000.00. So i try custom option ,but its not working for me. i attached image below. suggest me a solution.

{
  "title": "BD Wise Enquiry Value",
  "tooltip": {
    "useHTML": true,
    "formatter": "function() { return '<div class=\"graph-svg-tip comparison\">' + '<div class=\"title\">Value</div>' + '<ul>' + '<li class=\"tooltip-value\">' + this.point.y.toLocaleString('en-IN', { minimumFractionDigits: 2, maximumFractionDigits: 2 }) + '</li>' + '</ul>' + '</div>'; }"
  },
  "yAxis": {
    "title": "Tentative Enquiry Amount"
  }
}

