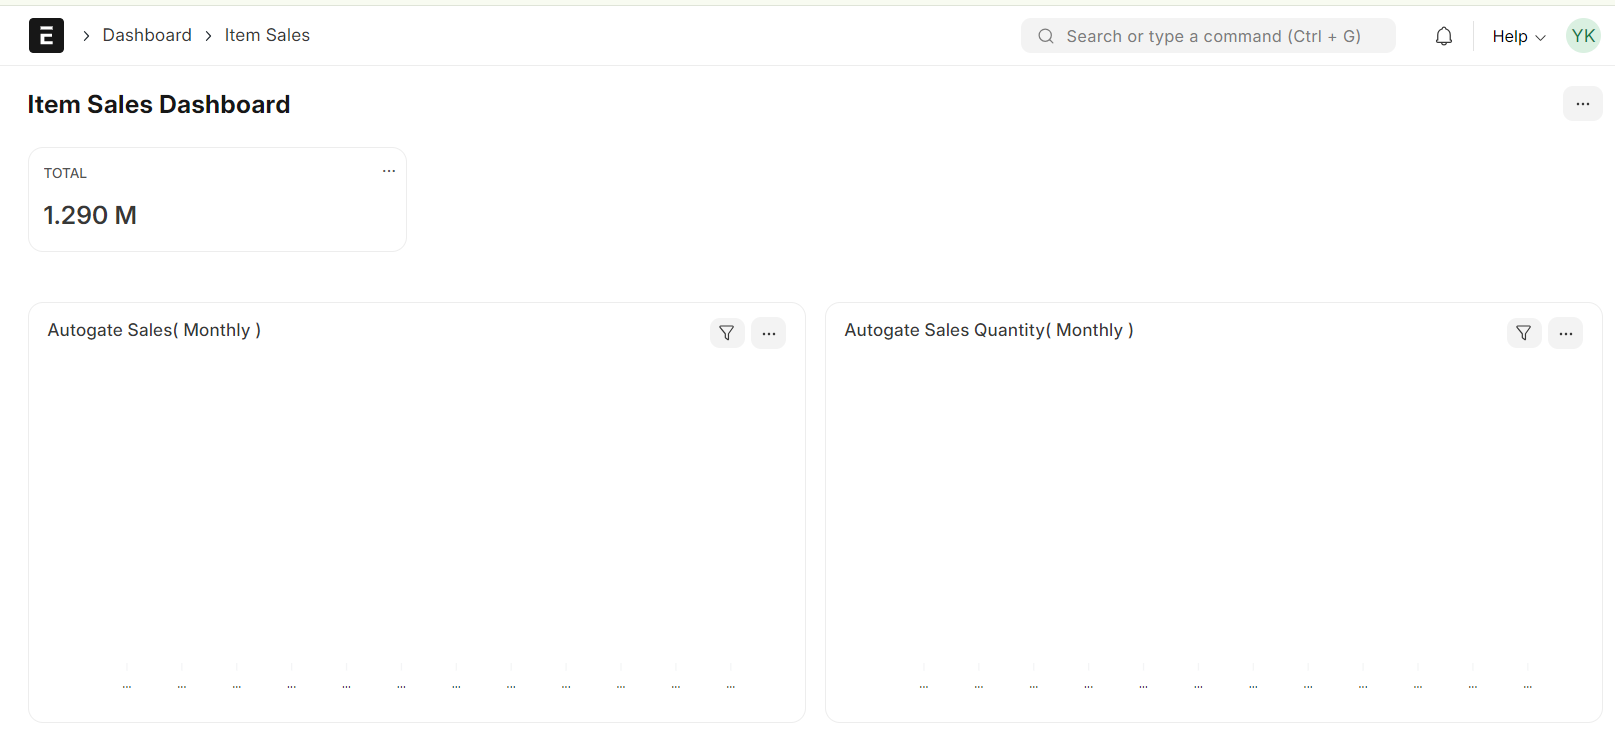
I have create a chart from Sales Analytics and add to a dashboard, but it is empty graph, what should i do?
1 Like
@Alan_Yong check filters.
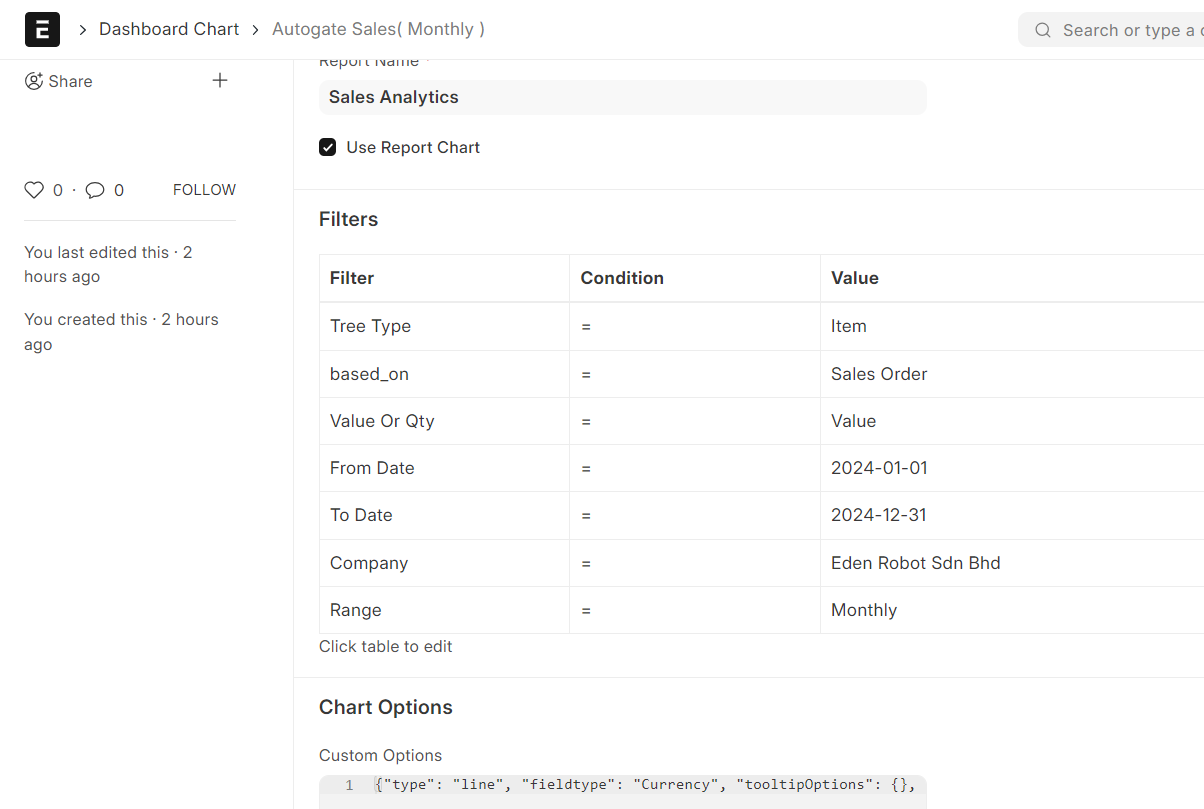
This is my current custom options
{“type”: “line”, “fieldtype”: “Currency”, “tooltipOptions”: {}, “axisOptions”: {“shortenYAxisNumbers”: 1}, “height”: 280}\
Anyone can guide me to get correct chart,
certain Item Sales vs months?
Please Help