Hi Community,
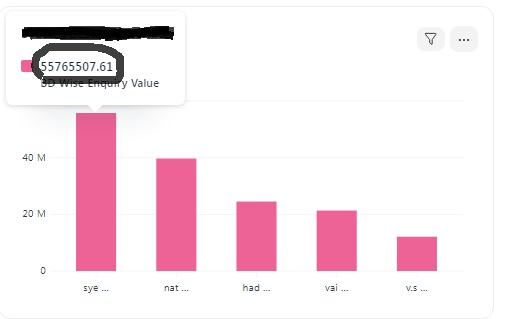
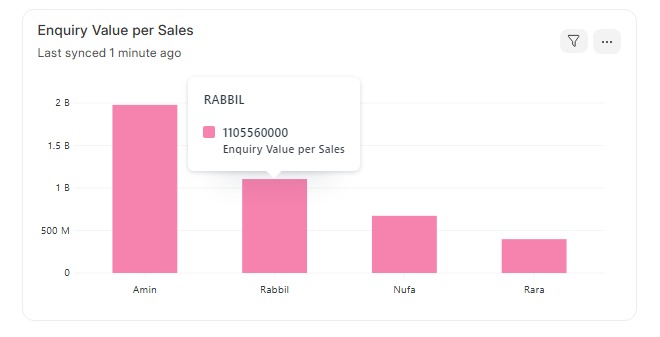
I have created dashboard chart for opportunity doctype based on owner, and their sum of opportunity amount. But, its shows like 3092292.00 instead of 3,00,000.00. I attached image below. Please, suggest me a Solution.

Hi Community,
I have created dashboard chart for opportunity doctype based on owner, and their sum of opportunity amount. But, its shows like 3092292.00 instead of 3,00,000.00. I attached image below. Please, suggest me a Solution.

PR already raised so please check it.
I Can’t able to Understand.
where i put the code? its from backend?
Please check the code changes in the Pull Request.
To be honest, I dont know what to do . will i use any client script?
If you don’t understand then wait for PR approval.
Brother, Can you please tell me how to achieve this in JSON?
It’s not a json code, it’s a js code. you have to update the code in the chart_widget.js file.
Is the below is correct?
frappe.ui.form.on('Dashboard Chart', {
    refresh: function(frm) {
        // Iterate through the charts in the dashboard
        frm.fields_dict.charts.grid.grid_rows.forEach(row => {
            if (row.chart.title === "BD Wise Enquiry Value") {
                // Update tooltip options for the specific chart
                row.chart.options.tooltipOptions = {
                    formatTooltipY: (value) => {
                        // Format the value to include commas and two decimal places
                        return frappe.format(
                            value,
                            { fieldtype: 'Currency', options: { precision: 2, always_show_decimals: true } },
                            { inline: true }
                        );
                    },
                };
                // Refresh the chart to apply changes
                row.chart.refresh();
            }
        });
    }
});
It’s does not worked in the client script, it’s a core code.
frappe/public/js/frappe/widgets/chart_widget.js
Open the chart_widget.js file and update the changes that i shared in the previous post.
Ok. Thank you.
Hello NCP,
I’m using ERPNext v15.54.0 with Frappe Framework v15.57.1.
Somehow the format is still not applied on the dashboard chart as shown in attachment below. The data source is a Currency and in List View it correctly shows the value.

Any ideas would be appreciated for troubleshooting this.
I’ve tried adding custom options adding “fieldtype” and “options” of “currency” as shown in the example from the PR but it didn’t work either.
Thank you!
@ptrmtb Please use the dashboard chart doctype add this details in the option field
{
“fieldtype”:“Currency”,
“options”: “Currency”
}
Hello Meet,
I have followed your advice like this, but the chart tooltip is not still formatted correctly ![]()
Any advise is appreciated…
Thank you!
Check your enquiry opportunity value field is currency field or not if that field is not currency field that it will not convert