Hi,
i need to edit or duplicate Delivery Note Trends Report. I want to remove column qt, item, total qty and add new column total percentage. Where could i find these to modify. In js file in report folder i found these.
frappe.require(“assets/erpnext/js/sales_trends_filters.js”, function() {
frappe.query_reports[“Delivery Note Trends”] = {
filters: get_filters()
Hello @vladucoju,
Columns and the queries used to pass data to the report are usually defined in the report’s python file.
On the other hand, the js file usually contains the filters. 
Hello,
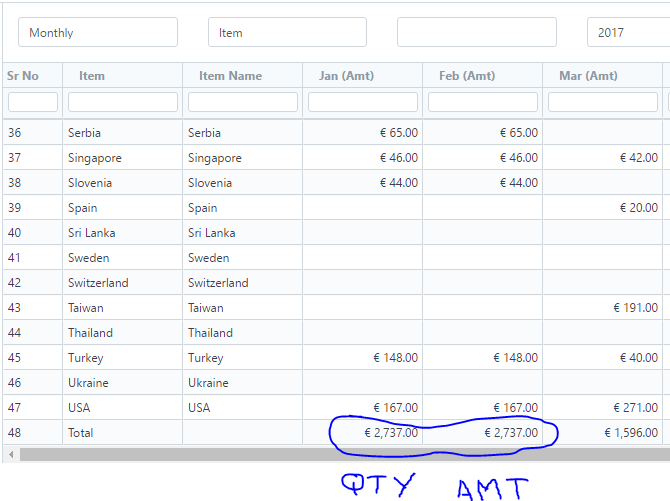
meanwhile i almost finsh this. I found controller file that is used for this report. Create new file for my report and now i am almost done. I have one more problem. I remove columns qty, but total amount is still calculating qty. Total amount is option from report.
Where can i change this to calculate only amount by months,quarter…?
I resolve this too. Now i wan’t to add total percentage column. I will try to do this too. Now it is much cleaner. I learn a lot about script queries. Thanks @littlehera. If you have some example about adding percantage it will help me.
I create this query
ROUND((SUM(qty)*100.0)/(SELECT SUM(qty) FROM tabDelivery Note Item dni, tabDelivery Note dn
WHERE dn.name=dni.parent),2)AS ‘%%’
I don’t understand Total (qry) row. I insert row header. Where can i add code for percent in group by rows?
group_by_cols = group_wise_column(filters.get(“group_by”))
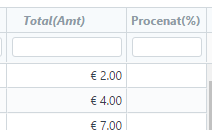
columns = based_on_details["based_on_cols"] + period_cols + [ _("Total(Amt)") + ":Currency:120"]+["Procenat(%)"]
if group_by_cols:
    columns = based_on_details["based_on_cols"] + group_by_cols + period_cols + \
        [_("Total(Amt)") + ":Currency:120"]
@vladucoju, you’ll have to add it to your dict variable before you append it and pass it to your return statement.
eg:
Code Inside the python file
columns = [
	{"label": "Item", 'width': 300, "fieldname": "item"},
	{"label": "Taken Qty", 'width': 120, "fieldname": "qty"},
	{"label": "Buying Price", 'width': 150, "fieldname": "price"},
	{"label": "Total", 'width': 150, "fieldname": "total"},
	{"label": "Percentage", 'width': 400, "fieldname": "percentage"},
	]
data = []#the dict variable to be passed to the js file handling the report

rows = frappe.db.sql("""your sql query""")

for row in rows:
	total = <your computation, if any>
	percentage = <your computation>
	data.append({"item": row[0], "qty":row[1], "price": row[2], "total":total, "percentage":percentage})


return data