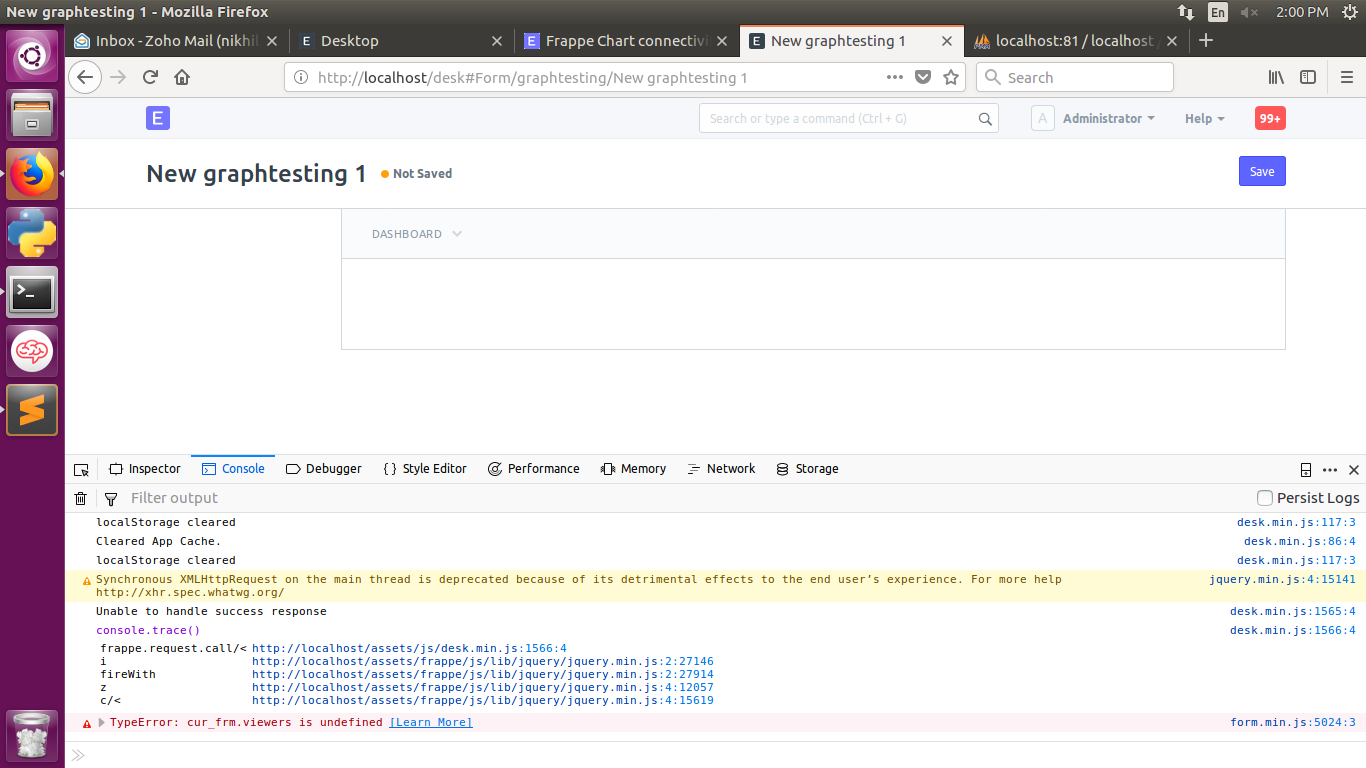
I am having issue with getting chart while using dynamic data ( directly to database). With static data its printing but now with direct connectivity to database. Need help in that.
My .py file is
from __future__ import unicode_literals
import frappe
from frappe.model.document import Document


@frappe.whitelist()

def state_wise():
	state=frappe.db.sql("select state from tabLead where state is not null group by state")
	lead=frappe.db.sql("select count(*) from tabLead where state is not null group by state")
	return state,lead
and .js file is
frappe.ui.form.on('graphtesting', {
	refresh: function(frm) {

$.getScript("https://cdn.jsdelivr.net/npm/frappe-charts@1.1.0/dist/frappe-charts.min.iife.js",function(){


frappe.call({
    method: "erpnext.selling.doctype.graphtesting.graphtesting.state_wise",
    args: {"state":cur_frm.doc.state,
    		"lead":cur_frm.doc.lead}
    callback: function(r) {
    if(r.message) {
       alert(r.message.state),
       alert(r.message.lead)
    },
});


let chart = new frappe.Chart( "#chart", {
    data: {
    	labels:[state]


      datasets: [
        {
          name: "Total Lead", chartType: 'bar',
          values:[lead]

        },

      ],


    },

    title: "State-Wise Lead Count",
    type: 'bar',
    height: 350,
    colors: ['blue'],

    tooltipOptions: {
      formatTooltipX: d => (d + '').toUpperCase(),
     formatTooltipY: d => d + ' pts',

}


});


});

	}
});