Hi All,
I have created a page now how can i create a fusion chart in that page.
https://frappe.github.io/charts/
based on this link i have started but its not working, I don’t know where i gone wrong.
No code, no error message. How do you expect someone to help?
1 Like
Hi
I have Created a page called test-chart.
in my JS File I added the script
let data = {
    labels: ["12am-3am", "3am-6am", "6am-9am", "9am-12pm",
      "12pm-3pm", "3pm-6pm", "6pm-9pm", "9pm-12am"],
    datasets: [
      {
        title: "Some Data",
        values: [25, 40, 30, 35, 8, 52, 17, -4]
      },
      {
        title: "Another Set",
        values: [25, 50, -10, 15, 18, 32, 27, 14]
      },
      {
        title: "Yet Another",
        values: [15, 20, -3, -15, 58, 12, -17, 37]
      }
    ]
  };
  let chart = new Chart({
    parent: "#chart",
    title: "My Awesome Chart",
    data: data,
    type: 'pie',
    height: 250,
    colors: ['#7cd6fd', 'violet', 'blue'],
    format_tooltip_x: d => (d + '').toUpperCase(),
    format_tooltip_y: d => d + ' pts'
  });
in my py file i added the script
import Chart from “/node_modules/frappe-charts/dist/frappe-charts.min.esm”
in my HTML i have added this script
<div id="chart"></div>
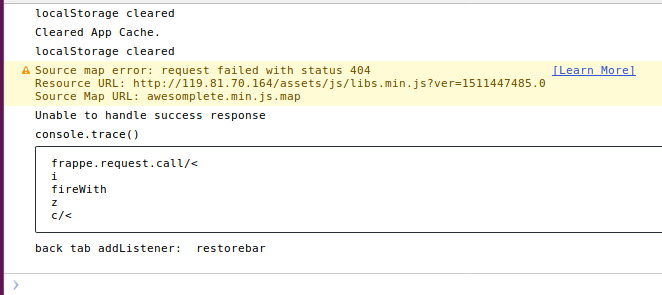
Finally i got this error
Hi @rmehta can you help me on this.
Have you been able to resolve it?
I am trying to implement it as well, however, I can’t figure out how to setup the modules in the background to be able to call the functions for a custom app
I understand the code to CALL the frappe chart within a page or doctype But what is proper inclusion technique? In the custom app (hooks.py)? Or is it best to include in build.json for frappe?
Hi @Tropicalrambler,
“…I understand the code to CALL the frappe chart within a page or doctype…”
Can you share how to do this as I really have no idea even after reading the chart guide. (I’m not a developer) ![]()
I actually managed to get a simplified working version to then modify.
Here is the article being written
1 Like
Thanks for your blog post, I’ve found it quite helpful, although I’m running into a bit of a problem. The test graph only displays when I resize my browser. I’m following your steps exactly in your Frappe Charts blog.
Any help would be great, thank you!
I know, this is a known issue and I am also trying to figure out how to resolve it. For better response, make sure you also create a Github issue with this. I did so for this instance:
Thank you for your reply @Tropicalrambler and for creating the Github Issue.
I’ve found a workaround and that is to add a draw in a timeout under where you create the chart as follows:
// existing code
const chart = new frappeChart.Chart(dedicated_div, options)
// add
setTimeout(function () {chart.draw(!0)}, 1);
2 Likes
Thanks, your solution works excellently! I’ll close the GitHub issue down, as this seems like a proper method, where you clearly command the graph to be drawn after a timeout!