Dear All
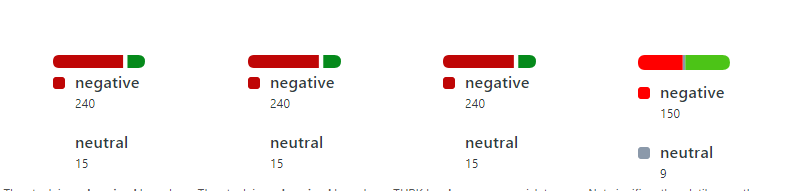
i want to decrease spaces and font size in tables
my code:
const chart1 = new frappe.Chart("#chart1", {
title: "",
data: {labels: ["negative", "neutral", "positive"],
datasets: [{ values: [80, 5, 20] },
{ values: [80, 5, 20] },
{ values: [80, 5, 20] }]
											},
								type: 'percentage',
								height: 190,
								barOptions: {
									height: 13,
								},
								colors: ['#bf0606', '#ffffff','#058a1b'],

								axisOptions: {
									xAxisMode: 'tick',
									xIsSeries: 0,
									xAxisLabel: 'Sentiments',
									xAxisLabelFontSize: 5,
								},
							});

						</script>
					</div>
				</td>
				<td style = "text-align: left ; vertical-align: top; ">
					<div id="chart2" style ="vertical-align: top;text-align: left ;width:100%; height: 10%"></div>
						<script>
							const chart2 = new frappe.Chart("#chart2", {
								title: "",
								data: {labels: ["negative", "neutral", "positive"],
									datasets: [{ values: [80, 5, 20] },
											   { values: [80, 5, 20] },
											   { values: [80, 5, 20] }]
											},
								type: 'percentage',
								height: 190,
								barOptions: {
									height: 13,
								},
								colors: ['#bf0606', '#ffffff','#058a1b']
							})
						</script>
				</td>
				</td>
				<td style = "text-align: left ; vertical-align: top; ">
					<div id="chart3" style ="vertical-align: top;text-align: left ;width:100%; height: 10%"></div>
						<script>
							const chart3= new frappe.Chart("#chart3", {
								title: "",
								data: {labels: ["negative", "neutral", "positive"],
									datasets: [{ values: [80, 5, 20] },
											   { values: [80, 5, 20] },
											   { values: [80, 5, 20] }]
											},
								type: 'percentage',
								height: 190,
								barOptions: {
									height: 13,
								},
								colors: ['#bf0606', '#ffffff','#058a1b']
							})
						</script>
				</td>
				<td>
				<div id="chart4" style ="vertical-align: top;text-align: left ;width:100%; height: 10%"></div>
				<script>

					const chart4 = new frappe.Chart("#chart4", {
						data:  {
							labels: ["negative", "neutral", "positive"],
							datasets: [
							{ values: [50, 3, 50] },
							{ values: [50, 3, 50] },
							{ values: [50, 3, 50] }
							]
						},
						type: 'percentage',
						height: 200,
							barOptions: {
								height: 15,
							},
						colors: ['#FF0000', '#8B99AA','#4CC417']
					})
				</script>
		  </td>
		</tr>