Frappe Charts in Page

Hello,
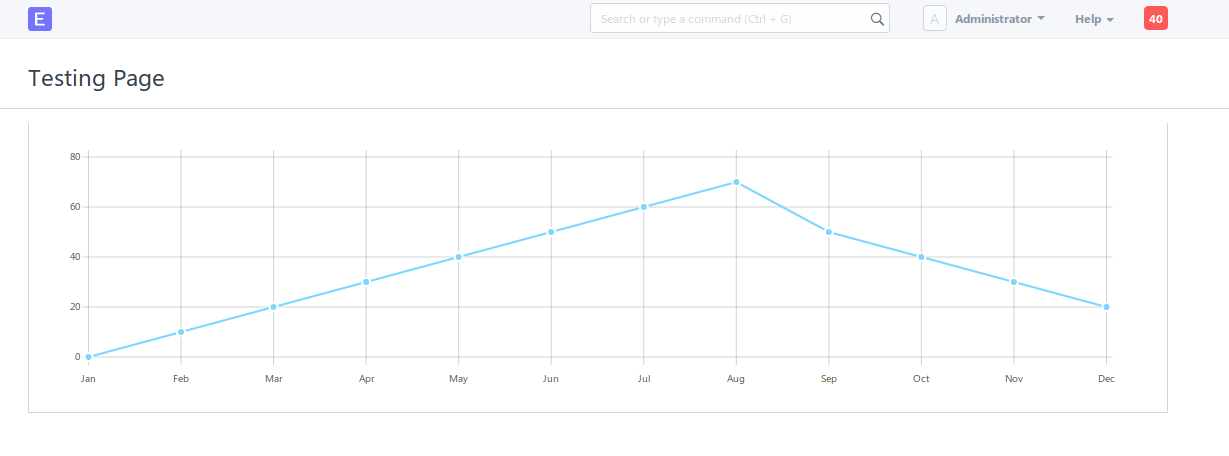
I’ve created a page for displaying charts,
i’ve tried some basic js script but its not working/showing anything.
somebody can please take a look and point the error in this,

JS:

frappe.pages['testing-page'].on_page_load = function(wrapper) {
	var page = frappe.ui.make_app_page({
		parent: wrapper,
		title: 'Testing Page',
		single_column: true
	});

	page.add_menu_item('Projects', () => frappe.set_route('List', 'Project'))

	const graph  = new frappe.ui.Graph({
		height: 140,
		parent: page.main,
		mode: 'line',
		x:{
			values:['Jan', 'Feb', 'Mar', 'Apr', 'May', 'Jun', 'Jul', 'Aug', 'Sep', 'Oct', 'Nov', 'Dec']
		},
		y:[{
			values:['23','23','23','23','23','23','23','23','23','23','23','23']
		}]
	});
}

HTML:
<div id="chart"></div>

Hi

Pls show js error. And what is version of frappe?

No error is there, i am just getting a white blank page,

Version:

ERPNext: v9.x.x-develop (dfb1646) (develop)
Frappe Framework: v9.x.x-develop (4a336aa) (develop)

Where to include this line of code?

And include it in your project

  import { Chart } from "frappe-charts"
1 Like

Exactly, tried a lot to achieve the same but never figured it out. Even documentation was not that clear on how to approach for the same. Hope someone gives the correct way/approach to follow here

Hi @shahid

Try this code with version 9

frappe.pages['testing-page'].on_page_load = function(wrapper) {
	var page = frappe.ui.make_app_page({
		parent: wrapper,
		title: 'Testing Page',
		single_column: true
	});

	wrapper = $(wrapper).find('.layout-main-section');
	wrapper.append(`
			<div id="chart"></div>
		`);


	const chart_data = {
		labels: ['Jan', 'Feb', 'Mar', 'Apr', 'May', 'Jun', 'Jul', 'Aug', 'Sep', 'Oct', 'Nov', 'Dec'],
		datasets: [
			{
				values:['0','10','20','30','40','50','60','70','50','40','30','20']
			}
		]
	};

	const graph = new frappe.chart.FrappeChart({
		parent: "#chart",
		data: chart_data,
		type: 'line'
	});

	setTimeout(function () {graph.refresh()}, 1);
}
2 Likes

@vinhnguyent090 thanks for help but its still not working,
i am getting this error in console,
console.trace() TypeError: "frappe.chart is undefined"

Hi @shahid

Pls share your file: apps/erpnext/erpnext/manufacturing/page/production_analytics/production_analytics.js

this.chart = new frappe.chart.FrappeChart({
			parent: ".chart",
			data: chart_data,
			type: 'line'
		});

And check your charts.js : apps/frappe/frappe/public/js/frappe/ui/charts.js

@vinhnguyent090

In my production_analytics.js i found code like this,

		this.chart = new Chart({
			parent: ".chart",
			data: chart_data,
			type: 'line'
		});

So i did this in my chart,

	const graph = new Chart({
		parent: "#chart",
		data: chart_data,
		type: 'line'
	});

And its start working, but there is no file with name chart.js in apps/frappe/frappe/public/js/frappe/ui/charts.js, is there any problem?

Hi @shahid

Now your page can show chart, If can don’t worry about charts.js

Ok thanks buddy.

1 Like

@vinhnguyent090 can you please guide me that how to fetch data from db and build chart from it? means now my chart have hard coded values, it should come from db. any example code will be appreciable.

Hi @shahid

I make example code for you

frappe.call({
		method: "yourapp.api.get_chart_data",
		callback: function(r) {
      		const chart_data = r.message;
			
			const graph = new frappe.chart.FrappeChart({
				parent: "#chart",
				data: chart_data,
				type: 'line'
			});

			setTimeout(function () {graph.refresh()}, 1);
		}
	})

your api.py

@frappe.whitelist()
def get_chart_data():
	
	query = """SELECT 
					MONTH(posting_date) as label,
					SUM(base_grand_total) AS data
				FROM
					`tabSales Invoice`
				WHERE
					docstatus = 1
				GROUP BY MONTH(posting_date)
			"""
	data = frappe.db.sql(query, as_list=1)

	datasets = []
	labels = []
	for d in data:
		labels.append(d[0])
		datasets.append(d[1])

	return {
		'labels': labels,
		'datasets': [{'values':datasets}]
	}
1 Like

BlockquotePls share your file: apps/erpnext/erpnext/manufacturing/page/production_analytics/production_analytics.js

There’s no file in production_analytics in mine. That folder is completely empty

this is the code I’m using

frappe.pages['charts'].on_page_load = function(wrapper) {
        var page = frappe.ui.make_app_page({
                parent: wrapper,
                title: 'Charts',
                single_column: true
        });
                page.add_menu_item('Lead', () => frappe.set_route('List', 'Lead'))

        wrapper = $(wrapper).find('.layout-main-section');
        wrapper.append('<div id="chart"></div>');


        const chart_data = {
                labels: ['Jan', 'Feb', 'Mar', 'Apr', 'May', 'Jun', 'Jul', 'Aug', 'Sep', 'Oct', 'Nov', 'Dec'],
                datasets: [
                        {
                                values:['0','10','20','30','40','50','60','70','50','40','30','20']
                        }
                ]
        };

        const graph = new frappe.chart.FrappeChart({
                                parent: "#chart",
                                data: chart_data,
                                type: 'line'
                        });

        setTimeout(function () {graph.refresh()}, 1);

}

but only getting unable to handle success response and blank page on screen

And on debuggin i came to know

const graph = new frappe.chart.FrappeChart({
                                parent: "#chart",
                                data: chart_data,
                                type: 'line'
                        });

this is causing this. I already had installed frappe-charts in frappe-bench using npm. Used this way also

new frappe.chart.FrappeChart({"chart",{
.......
rest code

and

new Chart({"#chart",{
rest code
};
});

But all producing the same thing … A blank page and in console, unable to handle success response.

Any suggestions where I headed wrong. Using the latest staging version (erp v34 and frappe v48)

@vinhnguyent090 Thank you so much.

1 Like

Hi @nikzz

Pls give me your version

bench version

ERPNext: v11.0.3-beta.34 () (staging)

Frappe Framework: v11.0.3-beta.48 () (staging)

and bench version

4.1.0

Hi @nikzz

try it

frappe.pages['charts'].on_page_load = function(wrapper) {
	var page = frappe.ui.make_app_page({
		parent: wrapper,
		title: 'Testing Page',
		single_column: true
	});

	wrapper = $(wrapper).find('.layout-main-section');
	wrapper.append(`
			<div id="chart"></div>
		`);
		
	const chart_data = {
		labels: ['Jan', 'Feb', 'Mar', 'Apr', 'May', 'Jun', 'Jul', 'Aug', 'Sep', 'Oct', 'Nov', 'Dec'],
		datasets: [
			{
					values:['0','10','20','30','40','50','60','70','50','40','30','20']
			}
		]
	};

	const graph = new Chart("#chart", {
		data: chart_data,
		type: 'line',
		height: 250
	})

	setTimeout(function () {graph.draw(!0)}, 1);
}

Not worked. Still same issue

It show error or some thing?

try to add alert.

alert(1);