Frappe v16 WebSocket Issues

We upgraded to v16 and have noticed that all real time notifications have stopped working. I spent a good chunk of time today trying to debug but can’t figure out the problem. Here is kind of a run down at what I have looked at:

Redis Is Running

I have redis running on port 12000. I tried changing the IP binding from 127.0.0.1 to 0.0.0.0. Played around with other config options in the config file to no avail. But I can confirm it’s running and I can connect to it. When I do redis-cli -p 12000 PUBSUB CHANNELS, it returns “(empty array)”. If I do redis-cli -p 12000 MONITOR it initially returns OK but nothing beyond that.

Site Configuration

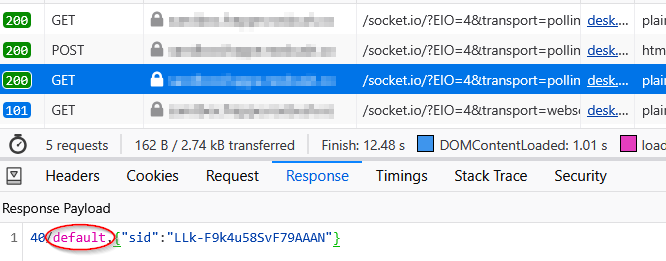
In file sites/common_site_config.json, I confirmed that parameter “redis_socketio” is set to “redis://127.0.0.1:12000”. I saw in a different forum post about appending “?protocol=3” at the end which I tried but no luck. Nonetheless, it appears to be configured correctly.

SocketIO

The socketio.js program is running. In version 15 I was originally running it as /usr/bin/node /work/frappe/apps/frappe/socketio.js --redis-url redis://127.0.0.1:12000but ChatGPT told me to remove the command line option and instead set environmental variable REDIS_SOCKETIO to “redis://127.0.0.1:12000”. The program is running and the logs don’t show any errors either way I have it but I do notice in the standard log it only shows the following:

Realtime service listening on: ws://0.0.0.0:9000

Nothing about being connected to Redis.

Debugging

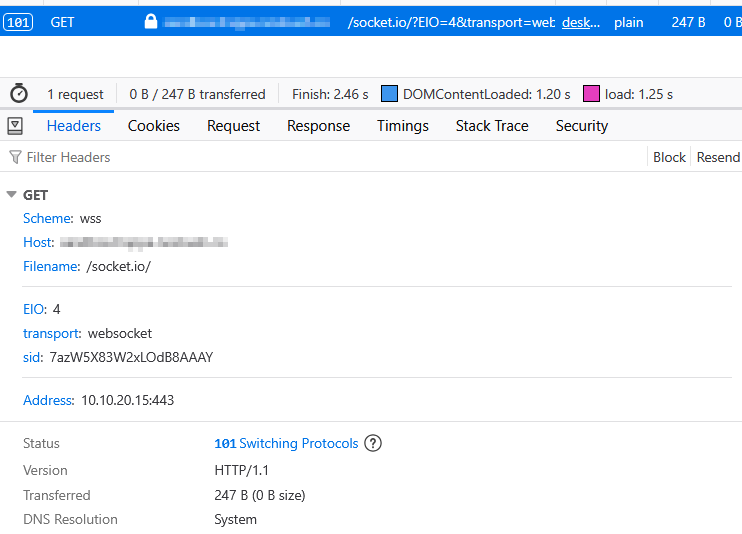
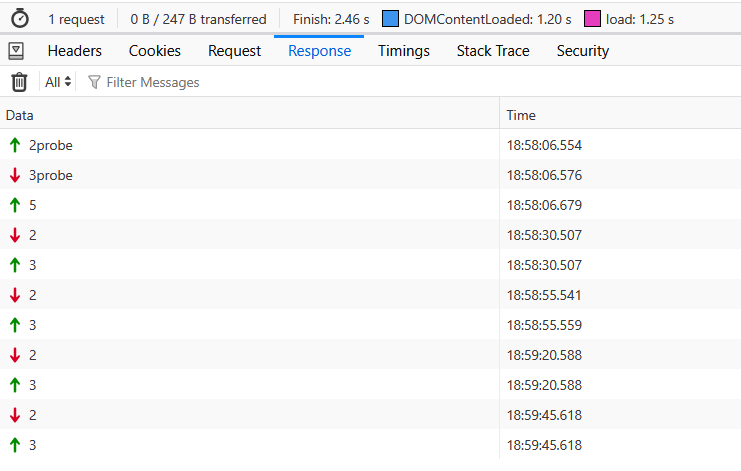
Using wscat, I am able to connect to the websocket and get a response which seems to indicate that at least the connection between the public internet and SocketIO is sound.

username@hostname:~$ wscat -c wss://my.frappe.server.com/socket.io/?EIO=4\&transport=websocket
Connected (press CTRL+C to quit)
< 0{"sid":"asGWzYvHIpUhhxQCAAAE","upgrades":[],"pingInterval":25000,"pingTimeout":20000,"maxPayload":1000000}

On my Frappe site I added the following JavaScript to try and help debug:

frappe.realtime.on("systemwide.broadcast", function(data) {
    // data will be whatever you send from Python
    frappe.show_alert({
        message: __("Broadcast message: " + data.message),
        indicator: "blue"
    });
    console.log("Realtime broadcast received:", data);
});
console.log("Realtime should be in place!");

And then I both tried running python code from bench console and going into redis directly to try and trigger but no luck.

Python:

import frappe
frappe.publish_realtime(event="systemwide.broadcast",message={"message": "Hello World"},  room="socketio#global")

Redis Console:

$ redis-cli -p 12000
PUBLISH socketio#global '{"event":"systemwide.broadcast","message":{"message":"Hello World!"}}'

I’m running version 16.2.0. Has anyone else encountered this and/or have any other suggestions of what I may be missing here?

UPDATE: I started digging into the code in socketio.js and found that the parameter it is actually using is “redis_queue” which is configured for port 11000. So I’m not sure if “redis_socketio“ is used for anything anymore?

I started monitoring port 11000 (redis-cli -p 11000 MONITOR) and published a message through python and I do see it come through which is promising:

frappe.publish_realtime(event="systemwide.broadcast",message={"message": "Hello World"},room="socketio#global")
1769648207.826464 [0 127.0.0.1:47654] "PUBLISH" "events" "{\n \"event\": \"systemwide.broadcast\",\n \"message\": {\n  \"message\": \"Hello World\"\n },\n \"namespace\": \"default\",\n \"room\": \"socketio#global\"\n}"

So that confirms that Frappe and Redis are not the problem but the website still is not receiving the messages.

It appears the web browser is connecting successfully to the WebSocket (WS):

Below is what I see under response although I don’t know what this means.

I am using Apache2 as a proxy. I didn’t change anything in my config between v15 and v16. Below is the part dealing with the WS.

    # Enable the rewrite engine
    # Requires: sudo a2enmod proxy rewrite proxy_http proxy_wstunnel
    # In the rules/conds, [NC] means case-insensitve, [P] means proxy
    RewriteEngine On

    # socket.io 1.0+ starts all connections with an HTTP polling request
    RewriteCond %{QUERY_STRING} transport=polling       [NC]
    RewriteRule /socket.io/(.*)           http://127.0.0.1:8000/socket.io/$1 [P]

    # When socket.io wants to initiate a WebSocket connection, it sends an
    # "upgrade: websocket" request that should be transferred to ws://
    RewriteCond %{HTTP:Upgrade} websocket               [NC]
    RewriteRule /socket.io/(.*)           ws://127.0.0.1:9000/socket.io/$1  [P]

So if I’m reading everything correctly, the socket is successfully opened between the browser and Frappe, messages are successfully getting sent to Redis from Frappe, but for whatever reason, they don’t get from Redis back to the browser.

Good debugging so far. A few additional things you can check:

Namespace sanity check : Your Redis output shows “namespace”: “default”. This can be normal, but it’s still worth confirming that the browser and the socketio server are operating on the same namespace. You can verify what the browser connects to in the Network tab.

SocketIO server logs : What does the Node.js socketio process show? Try running bench start in the foreground or checking supervisor logs. You should see subscription activity and any errors when events are published.

Redis subscription : In your Redis MONITOR, do you see the socketio process issuing a SUBSCRIBE “events” command when it starts? If not, messages won’t be delivered.

Room membership : Typically the client joins socketio#global. Check the socketio server logs for room join events when the browser connects, or look at the WebSocket messages in the browser Network tab for join/subscribe activity.
What does the socketio process log show when an event is published?

Is this where I wound find the namespace on the client?

SocketIO server logs : What does the Node.js socketio process show? Try running bench start in the foreground or checking supervisor logs. You should see subscription activity and any errors when events are published.

Here is the beginning of the output for bench start. I don’t see anything concerning.

22:23:59 system        | redis_cache.1 started (pid=25487)
22:23:59 system        | redis_queue.1 started (pid=25489)
22:23:59 system        | web.1 started (pid=25496)
22:23:59 system        | socketio.1 started (pid=25497)
22:23:59 system        | watch.1 started (pid=25502)
22:23:59 system        | schedule.1 started (pid=25504)
22:23:59 system        | worker.1 started (pid=25509)
22:23:59 redis_cache.1 | 25492:C 28 Jan 2026 22:23:59.968 # WARNING Memory overcommit must be enabled! Without it, a background save or replication may fail under low memory condition. Being disabled, it can also cause failures without low memory condition, see https://github.com/jemalloc/jemalloc/issues/1328. To fix this issue add 'vm.overcommit_memory = 1' to /etc/sysctl.conf and then reboot or run the command 'sysctl vm.overcommit_memory=1' for this to take effect.
22:23:59 redis_cache.1 | 25492:C 28 Jan 2026 22:23:59.968 * oO0OoO0OoO0Oo Redis is starting oO0OoO0OoO0Oo
22:23:59 redis_queue.1 | 25494:C 28 Jan 2026 22:23:59.968 # WARNING Memory overcommit must be enabled! Without it, a background save or replication may fail under low memory condition. Being disabled, it can also cause failures without low memory condition, see https://github.com/jemalloc/jemalloc/issues/1328. To fix this issue add 'vm.overcommit_memory = 1' to /etc/sysctl.conf and then reboot or run the command 'sysctl vm.overcommit_memory=1' for this to take effect.
22:23:59 redis_cache.1 | 25492:C 28 Jan 2026 22:23:59.968 * Redis version=8.0.2, bits=64, commit=00000000, modified=0, pid=25492, just started
22:23:59 redis_queue.1 | 25494:C 28 Jan 2026 22:23:59.968 * oO0OoO0OoO0Oo Redis is starting oO0OoO0OoO0Oo
22:23:59 redis_cache.1 | 25492:C 28 Jan 2026 22:23:59.968 * Configuration loaded
22:23:59 redis_queue.1 | 25494:C 28 Jan 2026 22:23:59.968 * Redis version=8.0.2, bits=64, commit=00000000, modified=0, pid=25494, just started
22:23:59 redis_queue.1 | 25494:C 28 Jan 2026 22:23:59.968 * Configuration loaded
22:23:59 redis_cache.1 | 25492:M 28 Jan 2026 22:23:59.968 * monotonic clock: POSIX clock_gettime
22:23:59 redis_queue.1 | 25494:M 28 Jan 2026 22:23:59.968 * monotonic clock: POSIX clock_gettime
22:23:59 redis_cache.1 | 25492:M 28 Jan 2026 22:23:59.969 * Running mode=standalone, port=13000.
22:23:59 redis_queue.1 | 25494:M 28 Jan 2026 22:23:59.969 * Running mode=standalone, port=11000.
22:23:59 redis_cache.1 | 25492:M 28 Jan 2026 22:23:59.969 * Server initialized
22:23:59 redis_queue.1 | 25494:M 28 Jan 2026 22:23:59.969 * Server initialized
22:23:59 redis_cache.1 | 25492:M 28 Jan 2026 22:23:59.969 * Ready to accept connections tcp
22:23:59 redis_queue.1 | 25494:M 28 Jan 2026 22:23:59.969 * Loading RDB produced by version 8.0.2
22:23:59 redis_queue.1 | 25494:M 28 Jan 2026 22:23:59.969 * RDB age 69 seconds
22:23:59 redis_queue.1 | 25494:M 28 Jan 2026 22:23:59.969 * RDB memory usage when created 1.76 Mb
22:23:59 redis_queue.1 | 25494:M 28 Jan 2026 22:23:59.972 * Done loading RDB, keys loaded: 329, keys expired: 2.
22:23:59 redis_queue.1 | 25494:M 28 Jan 2026 22:23:59.972 * DB loaded from disk: 0.003 seconds
22:23:59 redis_queue.1 | 25494:M 28 Jan 2026 22:23:59.972 * Ready to accept connections tcp
22:24:00 socketio.1    | Realtime service listening on: ws://0.0.0.0:9000

Redis subscription : In your Redis MONITOR, do you see the socketio process issuing a SUBSCRIBE “events” command when it starts? If not, messages won’t be delivered.

Are you saying when I run bench start? Redis wouldn’t be running until I run the start so I can’t check.

Room membership : Typically the client joins socketio#global. Check the socketio server logs for room join events when the browser connects, or look at the WebSocket messages in the browser Network tab for join/subscribe activity.
What does the socketio process log show when an event is published?

The socketio log doesn’t have much of anything in it. It just logs Realtime service listening on: ws://0.0.0.0:9000upon start. Is there a way to turn on more debugging for it?

I tried running the socketio.js directly to see if any errors were returned but it started normally:

/work/nvm/versions/node/v24.13.0/bin/node /work/frappe/apps/frappe/socketio.js
Realtime service listening on: ws://0.0.0.0:9000

I got it to work although I’m not sure I like it. I figured out the problem was with Apache. When I connected directly, bypassing Apache, things worked as normal. I know you may ask why not use Nginx and in the future I’m going to consider that but at the moment I’m stuck with it.

I played around with different Apache configurations and landed on the following:

    # Socket.IO WebSocket support
    <Location /socket.io/>
        # Use WebSocket protocol
        ProxyPass "ws://127.0.0.1:9071/socket.io/"
        ProxyPassReverse "ws://127.0.0.1:9071/socket.io/"

        # Upgrade headers for WebSocket
        RequestHeader set Upgrade "expr=%{HTTP:Upgrade}"
        RequestHeader set Connection "expr=%{HTTP:Connection}"

        # Frappe-specific headers
        RequestHeader set X-Frappe-Site-Name "default"
        RequestHeader set Origin "http://127.0.0.1"
        RequestHeader set Host "expr=%{HTTP_HOST}"
    </Location>

    # Normal HTTP proxy for Frappe app
    ProxyPass "/" "http://127.0.0.1:9070/"
    ProxyPassReverse "/" "http://127.0.0.1:9070/"

A key piece was I had to set the origin to “http://127.0.0.1”. This is the part I’m uncomfortable with but for now am going to go with it.