Hello everyone
I’m looking to include a graphical chart in my custom doctype.
Use case: In this doctype, the reparation process of various clocks and jewelry pieces is handled.
There is always a clear deadline for the reparation.
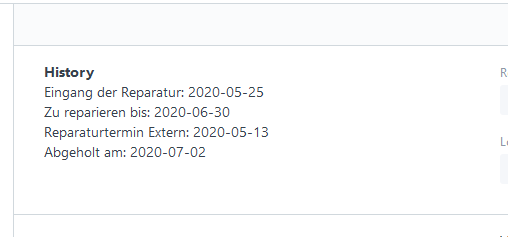
The shop can not repair everything itself, so some pieces have to be sent to an external supplier and again, a deadline is set. The whole document has various dates, which I’d like to keep track of in a timeline. Currently, I have it in textform, like so:

It does it’s job at showing which event happened when. But I’d like to beautify this using a chart.