In the new script report maker columns and filters can be easily set from the form and then python script can access filters but no way found to access columns.
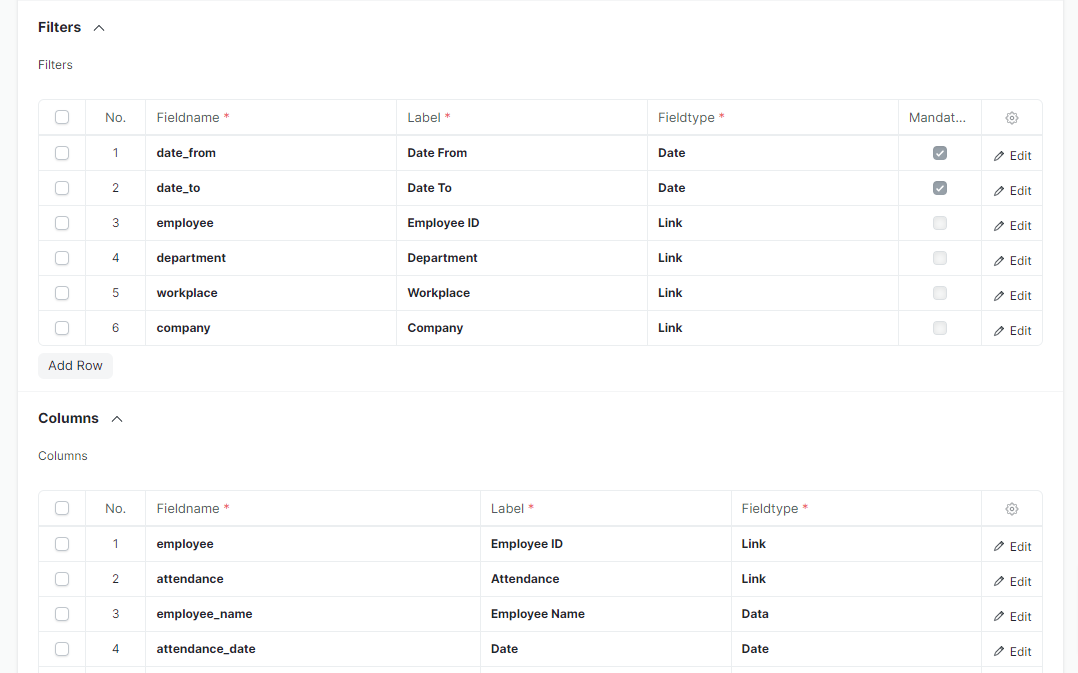
I need this because I want to add summary and charts to the report, since I did not find any way to pass summary and chart object in new style, and to use old style it looks like passing columns is a must.
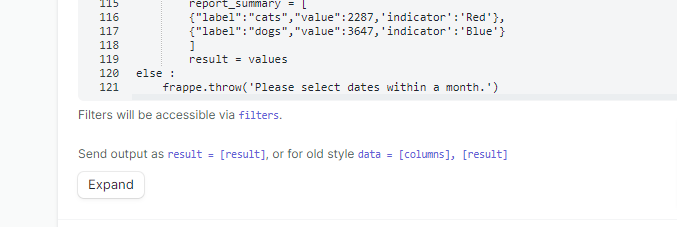
So how can I pass chart and summary objects in the new script report maker?
Warm Regards!