How to create dashboard in ERPNext

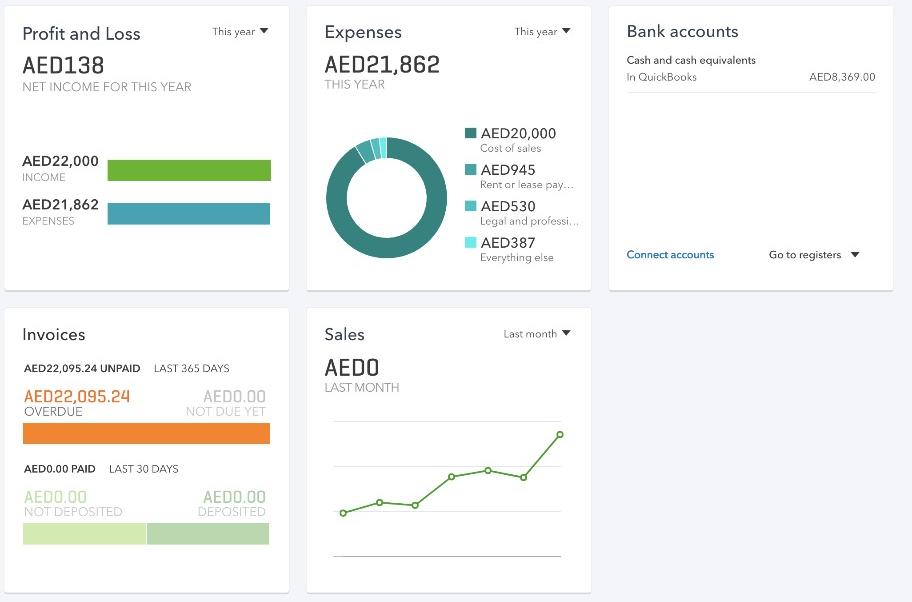
I searched so much on internet and find of ways of creating dashboard in ERPNext. Actually I want to design a dashboard like this one

I followed so many wasy to accomplish this task but don’t succeed. For example I create page and then follow toturials like this one.
Faris Ansari - Frappe UI, Creating Dashboard and Reports - YouTube
Frappe Charts: Simple and Modern SVG Charts
Chart Gallery  |  Charts  |  Google Developers

But I am not succeeded till this time. It will be very appreciable for me if you help me in creating dashbard in erpnext.
3 Likes

Have you looked into creating a Page and then putting your code there?

1 Like

use metabase to create dashboard, Simple BI tool for data visualization.

1 Like

By this this concept
Faris Ansari - Frappe UI, Creating Dashboard and Reports - YouTube

1 Like

Yes, you can create dashboards by creating a Page in frappe and then adding the UI elements like charts, etc to your page.

There are existing pages in ERPNext which you can check out if your interested. The source code for the pages are also available in the app folder. :slight_smile:

Yes @littlehera I followed this way as I shared a YouTube link in my question. If you have other useful links kindly share with me.
Actually I am facing the issue that when I write a code for chart, it is not displaying on page. I tried so many ways and many links on internet but failed to draw the chart. Please help me here. It will be very appreciable for me.

You can check the Selling Module in ERPNext.

Go to apps/erpnext/erpnext/selling/page. You should be able to see sales_funnel and sales_analytics which are 2 pages involving graphs.

Hello @sarmadmahmood969

What charts are you using for the page?

Hello @sarmadmahmood969

I like your dashboard page and I want it, Could we work together?

Hi @littlehera

I checked both these folders are there. sales_funnel folder having sales_funnel.css, sales_funnel.js, sales_funnel.json, sales_funnel.py and init.py files.

while sales_analytical having sales_analytical.js, sales_analytical.json and init.py files

any suggestion please…

Hi @iRaySpace

I tried frappe.Chart and frappe.ui.grraph to create a charts.

1 way is this, I followed this link here:

frappe.pages['dash1'].on_page_load = function(wrapper) {
var page = frappe.ui.make_app_page({
parent: wrapper,
title: 'Dashboard',
single_column: true
});

page.add_menu_item('Projects', () => frappe.set_route('List', 'Project'))

new frappe.Chart("#chart", {
data: data,
type: 'bar',
height: 140,
colors: ['red']
});

data = {
labels: ["Sun", "Mon", "Tue", "Wed", "Thu", "Fri", "Sat", "Sun"],
datasets: [{
				values: [18, 40, 30, 35, 8, 52, 17, -4]
			}]
}
}

The other one is that I tried:

frappe.pages['dash1'].on_page_load = function(wrapper) {
var page = frappe.ui.make_app_page({
parent: wrapper,
title: 'Dashboard',
single_column: true
});

console.log(page)

page.add_menu_item('Projects', () => frappe.set_route('List', 'Project'))

const graph = new frappe.ui.Graph({
height: 140,
parent: page.main,
mode: 'line',
x: {
	values: ['Jan', 'Feb', 'Mar', 'Apr', 'May', 'Jun', 'Jul',
					'Aug', 'Sep', 'Oct', 'Nov', 'Dec']
},
y: [{
	values: [23, 34, 23, 56, 83, 2, 92, 1, 90, 34, 67, 78]
}]
});
}

Any help please.

Hi @vinhnguyent090

yes we can work together. You are welcome.

I think you need to add the graph to an HTML element or <div> block in your page.

As for the files, you can try checking the .js files for the javascript code.

Hi. Like @rk_root said, and also based on my experience, the EASIEST way is to use a BI tool (think Metabase if you’re going opensource). Create your dashboards there, publish them and embed them in a page (not Web Page) you’ve created in ERPNext. And voila! you get what you want.

2 Likes

Thank @sarmadmahmood969 I sent email my contact. pls check thanks,

I sent an email to you

1 Like

Hello @sarmadmahmood969

I believe you have to create a div with an id of “chart” as what @littlehera said.

// Create a div with an id of chart and attach it to the page
this.$chart = $('<div id="chart">').hide().appendTo(this.page.main);

// Create the charts
this.chart = new Chart(this.$chart[0], options);

// Show the charts since it is added as hidden
this.$chart.show();

Let us know what you have accomplished so far.

can you tell me please on which page these lines have to be added

hi, by using frappe charts you can make beautiful chart for your page and by adding some custom css
it works great. see my pages…

5 Likes

Hi @Sahil

Can you please share how you create all this…