I have this attendance doctype:
“field_order”: [
“attendance_location”,
“employee”,
“type”,
“photo”,
“take_meal_allowance”,
“column_break_achi”,
“attendance_time”,
“latitude”,
“longitude”,
“permission”,
“remarks”,
“late”
]
And i have dashboard and report page.
My case is i want to make chart like this, i dont care about the design i just need to make pie chart with custom data
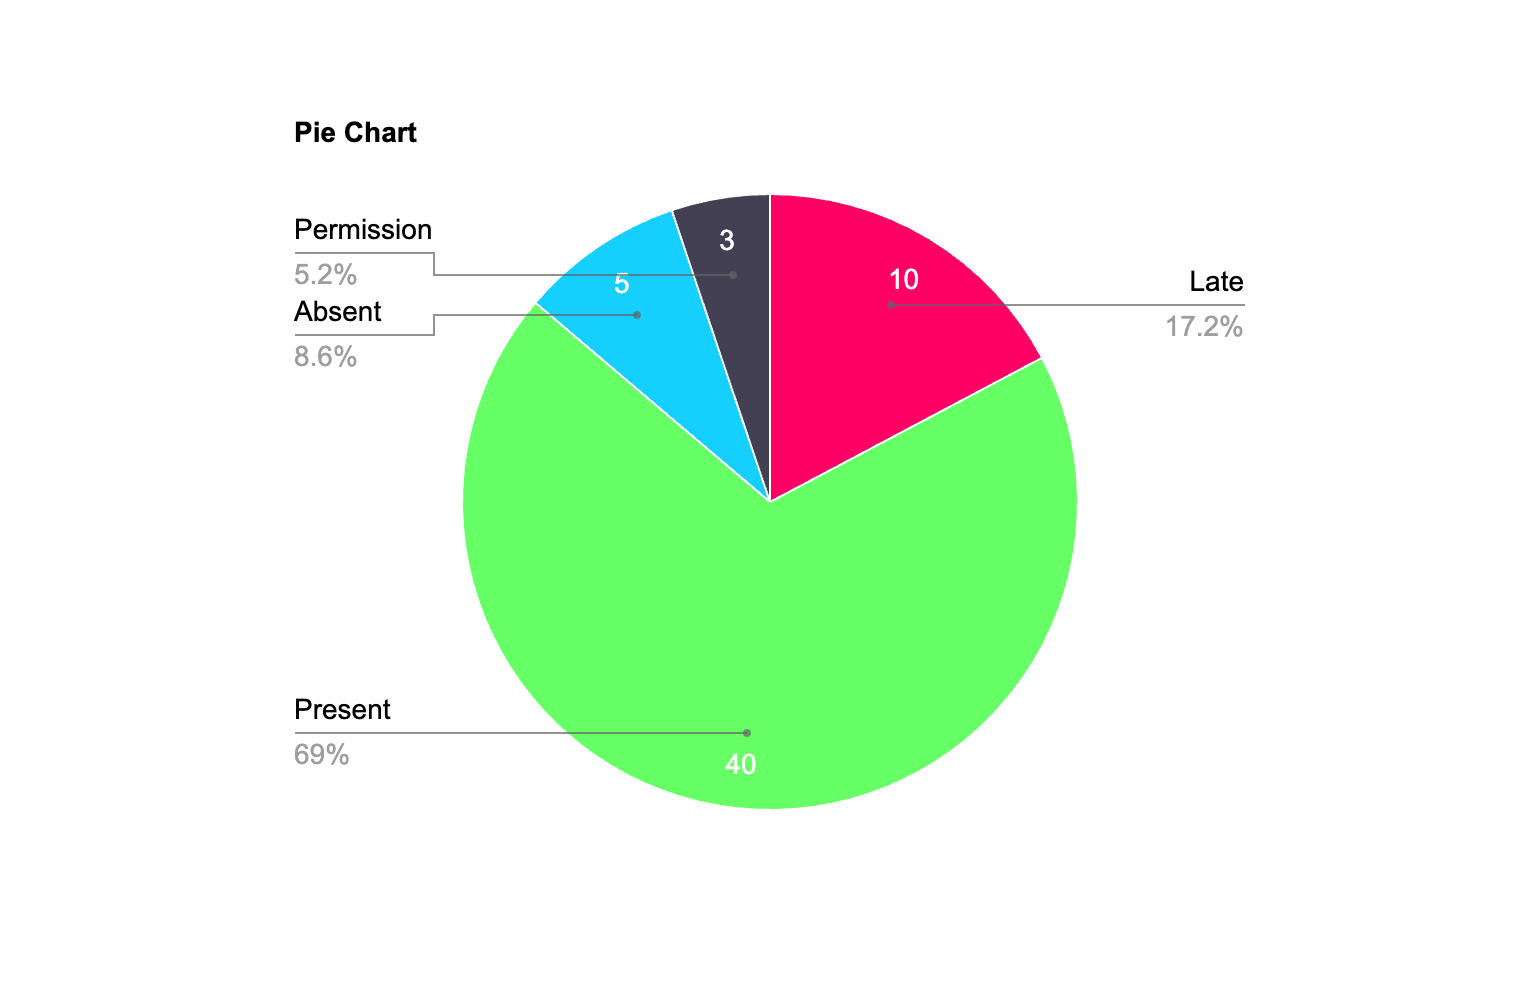
For example the timeline is for this month
Late: Count all data where late == 1
Present: Count all data where is not permission
Absent: Total all employee * 30 (Total day on this month) - Total attendance this month where type == in && permission != 1
Permission: Count all data where permission == 1
Please help me.
What have i done?
I try to make dashboard chart like this
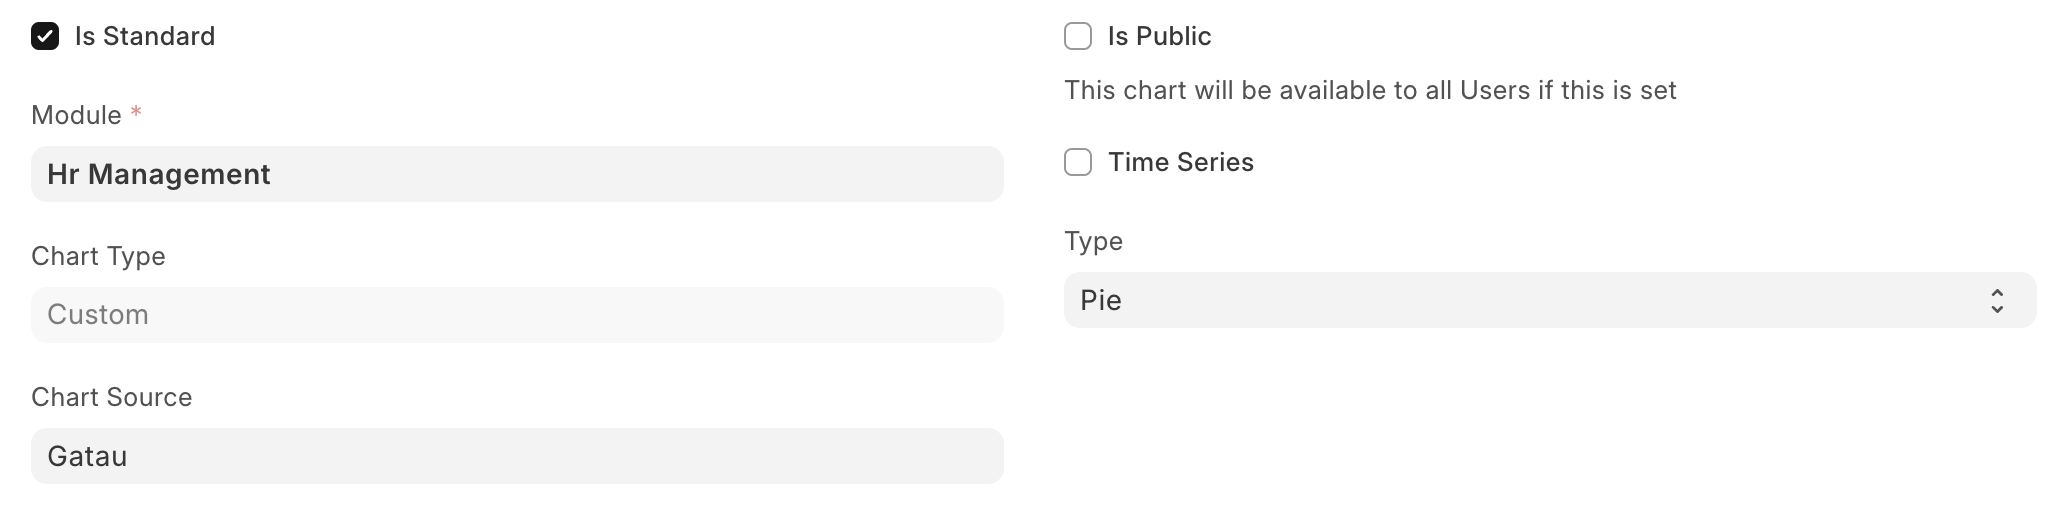
But i didnt know what should i put on Chart Source client script and server script.
Thank you!