I have created a dashboard based on a reasonably complex sub-query.
Chart used was:
Custom,
Chart Source: I created a chart source and the dashboard is showing the chart.
I used datasets = frappe.db.sql(s_sql, as_dict=1) to extract data.
The query works perfectly in mysql and returns 10 rows.
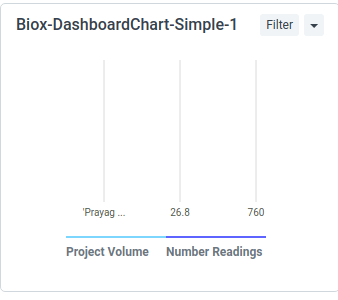
However, when I look at the chart, there is only one row.
a. It takes the first project (as label(
b. It sums all the numeric values
So I get a dashboard with a single bar chart.
I have whitelisted the function. I’m not sure why I’m getting a single row.
def get_flow_measurement(projects, filters):
# frappe.msgprint(projects)
filter_doc_status = “”" (0, 1) “”" if filters[‘show_drafts’] == 1 else “”" (1)“”"
filter_projects = “('” + “', '”.join([row[‘name’] for row in projects]) + “')”
# frappe.msgprint(filters['to_date'])
# frappe.msgprint(filters['from_date'])
# frappe.msgprint(filter_projects)

s_sql = f"""
            select
            twm.customer
            , twm.project  as project
            , format(sum(twm.calculated_daily_volume),1)  as monthly_volume
            , sum(twm.num_readings) as num_readings
            from (
                    select
                        customer
                        , project
                        , date_format(measurement_date__time,"%%Y-%%m-%%d") as measurement_date__time
                        , format(avg(calculated_daily_volume),4) as calculated_daily_volume
                        , count(calculated_daily_volume) as num_readings
                    from `tabWater Height Measurement`  tw1
                    where
                    tw1.docstatus in {filter_doc_status}
                    and tw1.project in {filter_projects}
                    and tw1.measurement_date__time between \'{filters['from_date']}\' and \'{filters['to_date']}\'
                    group by date_format(measurement_date__time,"%%Y-%%m-%%d")
                    order by project, measurement_date__time

                )
            as twm
            group by customer, project
            order by customer, project
            """

# frappe.msgprint(s_sql);
datasets = frappe.db.sql(s_sql, as_dict=1)
# print(datasets)
s1= ", '".join(row['project'] for row in datasets)
frappe.msgprint(s1)
# frappe.msgprint(frappe.parse_json(datasets[0]['project']))

# axis_labels_dict=dict()
axis_labels = flow_volume_list = num_readings_list = list()
i=0
# list of projects and volume for the period
for row in datasets:
    axis_labels.append("'"+ row['project'] + "'")
    flow_volume_list.append(row['monthly_volume'])
    num_readings_list.append(row['num_readings'])

return flow_volume_list, num_readings_list, axis_labels
THIS is the Actual output
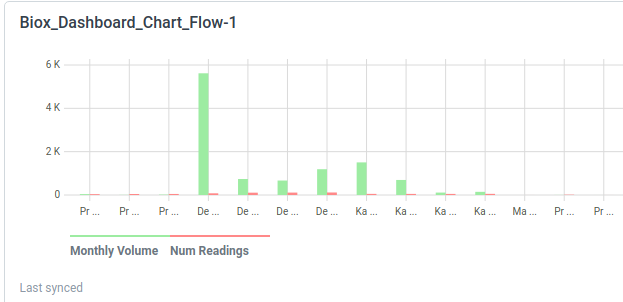
This is the expected Output
This was created ‘based on a query report’. Only problem here is that I can’t create filters.
Error in SQL all along.
s_sql = f"“”
select
twm.customer
, twm.project as project
, format(sum(twm.calculated_daily_volume),1) as monthly_volume
, sum(twm.num_readings) as num_readings
from (
select
customer
, project
, date_format(measurement_date__time,“%%Y-%%m-%%d”) as measurement_date__time
, format(avg(calculated_daily_volume),4) as calculated_daily_volume
, count(calculated_daily_volume) as num_readings
from tabWater Height Measurement tw1
where
tw1.docstatus in {filter_doc_status}
and tw1.project in {filter_projects}
and tw1.measurement_date__time between '{filters[‘from_date’]}' and '{filters[‘to_date’]}'
group by customer, project, date_format(measurement_date__time,“%%Y-%%m-%%d”)
order by customer, project, measurement_date__time
                )
            as twm
            group by customer, project
            order by customer, project
            """