Hello Everyone,
In Monthly Attendance Sheet When I select Group By - Departments then in Department Column gets html tag as below.
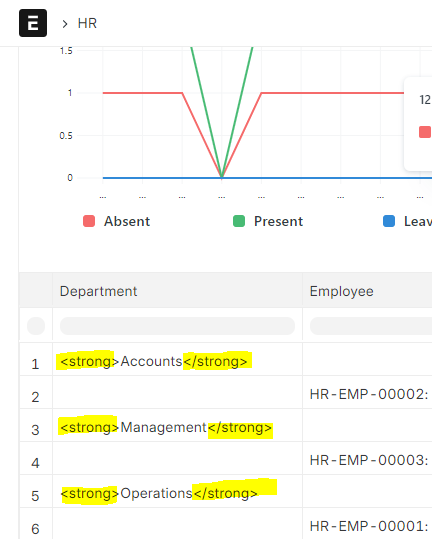
Please suggest how to rectify it.
Can we use this in formatter in .js file?
frappe.bold(value)
Hello Everyone,
In Monthly Attendance Sheet When I select Group By - Departments then in Department Column gets html tag as below.
Please suggest how to rectify it.
Can we use this in formatter in .js file?
frappe.bold(value)
I made some changes in below files and its working fine.
monthly_attendance_sheet.py
if records:
				data.append({group_by_column: value})
				data.extend(records)
monthly_attendance_sheet.js
if (!summarized_view) {
			if (group_by && column.colIndex == 1) {
				value = "<b>" + value + "</b>";
			}
OUTPUT:
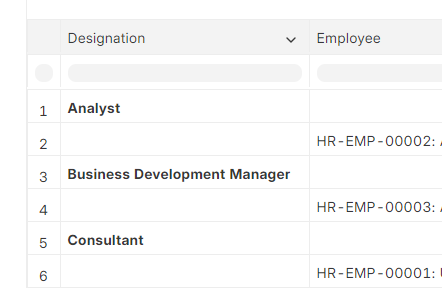
Is that correct way ?
Hi @umarless,
right.
But check the reference, if you want to add some color or something.
I hope this helps.
Thank You!
Hi @umarless,
Thank you for letting us know about this problem.
We’ve submitted a Pull Request for versions 15 and 14, so please take a look.
You can find it here:
Additionally, we’ve corrected the options_mapping.
Once the Pull Request is merged, the issue will be permanently resolved.
Thank You!