Hi,
Is it possible to overlap two or more dashboards line charts in a single chart.
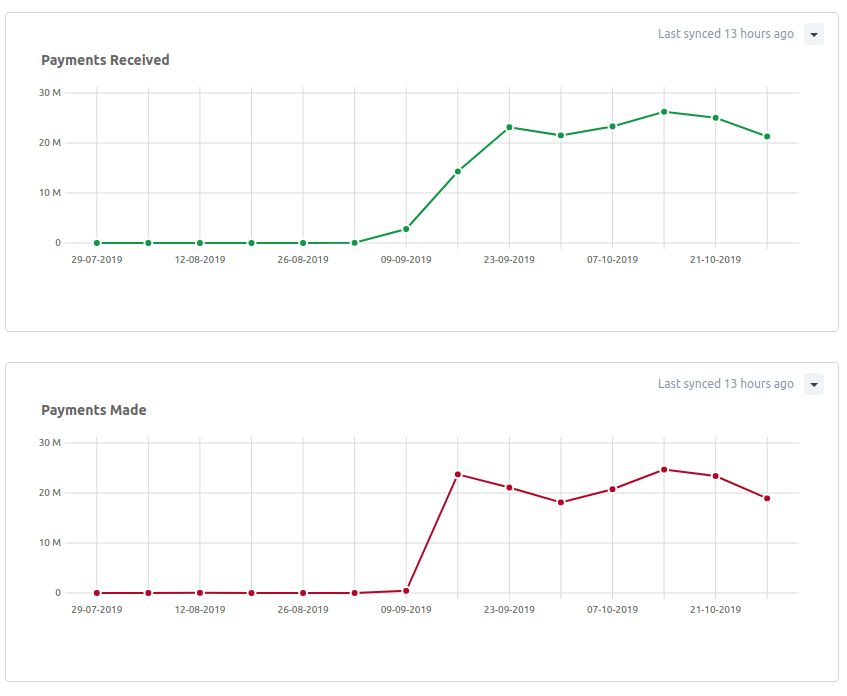
Use case: I want to track payments received and payment paid on the same chart.
Regards
2 Likes
I came to know that ERPNext uses Frappe Charts
For any one trying to achieve the multiple graphed charts in ERPNext must make custom chart source and return multiple datasets in .py file:
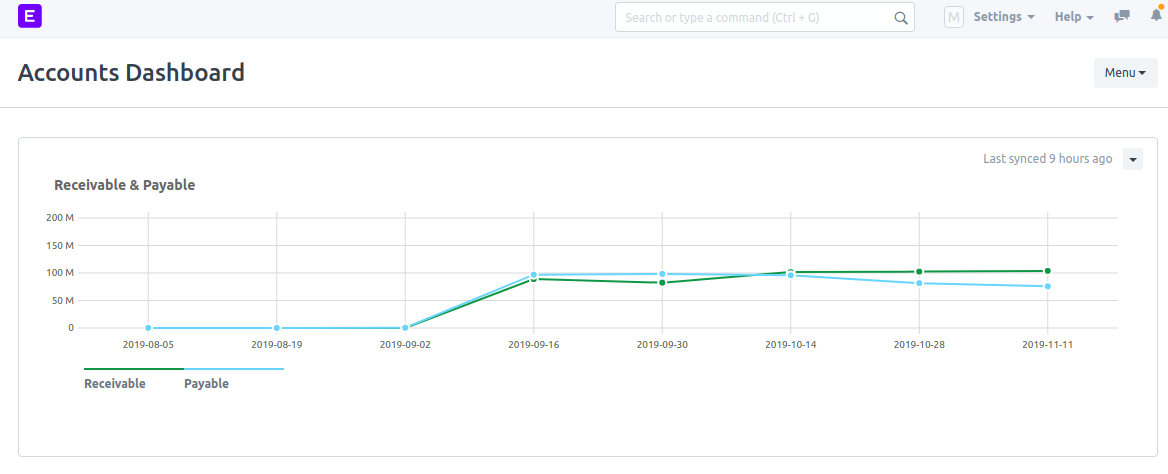
.py file for mapping accounts receivable and payable on the same chart. How ever I could not find a way to define chart colors and other attributes mentioned at Frappe Charts as they are generated in .js. Only one color can be changed while defining dashboard chart. Frappe Charts are very nice and anyone wants to leverage them can directly use ERPNext Page to write .js and .py files of the Page for adding charts to page and play with all the attributes.
Copyright (c) 2015, Frappe Technologies Pvt. Ltd. and Contributors
License: GNU General Public License v3. See license.txt
from future import unicode_literals
import frappe, json
from frappe.utils import add_to_date, date_diff, getdate, nowdate, get_last_day, formatdate
from erpnext.accounts.report.general_ledger.general_ledger import execute
from frappe.core.page.dashboard.dashboard import cache_source, get_from_date_from_timespan
from frappe.desk.doctype.dashboard_chart.dashboard_chart import get_period_endingfrom frappe.utils.nestedset import get_descendants_of
@frappe.whitelist()
@cache_source
def get(chart_name = None, chart = None, no_cache = None, from_date = None, to_date = None):
if chart_name:
chart = frappe.get_doc(‘Dashboard Chart’, chart_name)
else:
chart = frappe._dict(frappe.parse_json(chart))
timespan = chart.timespan
timegrain = chart.time_interval
filters = frappe.parse_json(chart.filters_json)account = filters.get(“account”)
company = filters.get(“company”)if not to_date:
to_date = nowdate()
if not from_date:
if timegrain in (‘Daily’,‘Weekly’,‘Monthly’, ‘Quarterly’):
from_date = get_from_date_from_timespan(to_date, timespan)fetch dates to plot
dates = get_dates_from_timegrain(from_date, to_date, timegrain)
Get balances on for set dates
receivable =
for date in dates:
sql_query_str = ‘’‘SELECT sum(debit)-sum(credit) FROMtabGL EntryWHERE company=“{0}” AND party_type=“Customer” AND posting_date<=“{1}”’‘’.format(company,date)
sql_query = frappe.db.sql(sql_query_str)
if sql_query[0][0]==None:
receivable.append(0)
else:
receivable.append(sql_query[0][0])
payable =
for date in dates:
sql_query_str = ‘’‘SELECT (sum(debit)-sum(credit))*-1 FROMtabGL EntryWHERE company=“{0}” AND party_type=“Supplier” AND posting_date<=“{1}”’‘’.format(company,date)
sql_query = frappe.db.sql(sql_query_str)
if sql_query[0][0]==None:
payable.append(0)
else:
payable.append(sql_query[0][0])return {
“labels”: [ date for date in dates ],
“datasets”: [{
“name”: ‘Receivable’,
“values”: receivable
},
{
“name”: ‘Payable’,
“values”: payable
}]
}def get_dates_from_timegrain(from_date, to_date, timegrain):
days = months = years = 0
if “Daily” == timegrain:
days = 1
elif “Weekly” == timegrain:
days = 7
elif “Monthly” == timegrain:
months = 1
elif “Quarterly” == timegrain:
months = 3dates = [get_period_ending(from_date, timegrain)]
while getdate(dates[-1]) < getdate(to_date):
date = get_period_ending(add_to_date(dates[-1], years=years, months=months, days=days), timegrain)
dates.append(date)
return dates
5 Likes
Hi, this is not working for me, could you please help.
I made a custom chart source called Multi, in Selling.
First, to test, I copied .py and .js files from
/frappe-bench/apps/erpnext/erpnext/accounts/dashboard_chart_source/account_balance_timeline/
to
/frappe-bench/apps/erpnext/erpnext/selling/dashboard_chart_source/multi
and renamed them to multi.js and multi.py
I changed multi.js to:
frappe.provide('frappe.dashboards.chart_sources');

frappe.dashboards.chart_sources["Multi"] = {
        method: "erpnext.selling.dashboard_chart_source.multi.multi.get",
        filters: [
                {
                        fieldname: "company",
                        label: __("Company"),
                        fieldtype: "Link",
                        options: "Company",
                        default: frappe.defaults.get_user_default("Company"),
                        reqd: 1
                },
                {
                        fieldname: "account",
                        label: __("Account"),
                        fieldtype: "Link",
                        options: "Account",
                        reqd: 1
                },
        ]
};
Then I made a new dashborad chart and new dashboard, just to test. So far everything works.
Then I changes multi.py to:
# Copyright (c) 2015, Frappe Technologies Pvt. Ltd. and Contributors
# License: GNU General Public License v3. See license.txt

from __future__ import unicode_literals
import frappe, json
from frappe import _
from frappe.utils import add_to_date, date_diff, getdate, nowdate, get_last_day, formatdate, get_link_to_form
from erpnext.accounts.report.general_ledger.general_ledger import execute
from frappe.core.page.dashboard.dashboard import cache_source, get_from_date_from_timespan
from frappe.desk.doctype.dashboard_chart.dashboard_chart import get_period_ending

from frappe.utils.nestedset import get_descendants_of

@frappe.whitelist()
@cache_source
def get(chart_name = None, chart = None, no_cache = None, from_date = None, to_date = None):
        if chart_name:
                chart = frappe.get_doc('Dashboard Chart', chart_name)
        else:
                chart = frappe._dict(frappe.parse_json(chart))
        timespan = chart.timespan

        if chart.timespan == 'Select Date Range':
                from_date = chart.from_date
                to_date = chart.to_date

        timegrain = chart.time_interval
        filters = frappe.parse_json(chart.filters_json)

        account = filters.get("account")
        company = filters.get("company")

        if not to_date:
                to_date = nowdate()
        if not from_date:
                if timegrain in ('Daily','Weekly','Monthly', 'Quarterly'):
                    from_date = get_from_date_from_timespan(to_date, timespan)

        # fetch dates to plot
        dates = get_dates_from_timegrain(from_date, to_date, timegrain)
# Get balances on for set dates
receivable = []
for date in dates:
sql_query_str = '''SELECT sum(debit)-sum(credit) FROM tabGL Entry WHERE company="{0}" AND party_type="Customer" AND posting_date<="{1}"'''.format(company,date)
sql_query = frappe.db.sql(sql_query_str)
if sql_query[0][0]==None:
receivable.append(0)
else:
receivable.append(sql_query[0][0])
payable = []
for date in dates:
sql_query_str = '''SELECT (sum(debit)-sum(credit))*-1 FROM tabGL Entry WHERE company="{0}" AND party_type="Supplier" AND posting_date<="{1}"'''.format(company,date)
sql_query = frappe.db.sql(sql_query_str)
if sql_query[0][0]==None:
payable.append(0)
else:
payable.append(sql_query[0][0])

return {
"labels": [ date for date in dates ],
"datasets": [{
"name": 'Receivable',
"values": receivable
},
{
"name": 'Payable',
"values": payable
}]
}


def get_dates_from_timegrain(from_date, to_date, timegrain):
        days = months = years = 0
        if "Daily" == timegrain:
                days = 1
        elif "Weekly" == timegrain:
                days = 7
        elif "Monthly" == timegrain:
                months = 1
        elif "Quarterly" == timegrain:
                months = 3

        dates = [get_period_ending(from_date, timegrain)]
        while getdate(dates[-1]) < getdate(to_date):
                date = get_period_ending(add_to_date(dates[-1], years=years, months=months, days=days), timegrain)
                dates.append(date)
        return dates
I made new dashboard chart, change it to custom and selected Multi as chart source. I selected filter for company and account (Although i don’t really understand why account, because SQL doesn’t need account at all, so I put random account)
Note - if I try without account filter, I get an error message " Account is not set for the dashboard chart [multi]"
So, now I open dashboard and refresh, the error message is:
The resource you are looking for is not available
And console:
jquery.min.js:4 POST https://xxx.xxx.xxx/api/method/erpnext.selling.dashboard_chart_source.multi.multi.get 404 (NOT FOUND)
As soon as i change the content of the multi.py file to match account_balance_timeline.py, it works, so I presume it loads from where it should.
Could you help me to find out where the error is?
thank you
To answer you question why it give error for Account. is that you have added account field in the source as mandatory. remove reqd: 1. You can add other fields as well if you like to use in your query. Other than that as you mentioned try to understand how the working chart source is written then you will be able to create one of your own ![]()
 {
                        fieldname: "account",
                        label: __("Account"),
                        fieldtype: "Link",
                        options: "Account",
                        reqd: 1
  },
1 Like
Yes I know about reqd: 1. With this settings you can’t even save chart without specifying Account. What I meant was that even if I remove Account filter or change reqrd to 0, I’m still getting that error message.
I am really trying to understand how it all works and why, but I would need some help, that is why I reached out to you.
Could you please maybe post one complete solution how to greate multiple charts, I believe many will benefit.
Thanks ![]()
Ok I will try when I get time ![]()
1 Like
Dear Sir,
I understand you might be busy but if you could spare some time and post a complete step by step solution, I think that many would benefit.
Thank you!
Maybe to help other beginners, the script above is actually fine. What I didn’t know that python doesn’t like inconsistent use of tabs and spaces in indentation. I found out when I compiled my .py file in the console.
Now I have one question for experienced guys;) How do I force refresh erpnext to read changes in my .py file? I’m now experimenting with the SQL query but it very unpredictable. I tried reload, refresh but without consistent results. For example, yesterday I made some changes, they were not reflected online in 10-15mins, but overnight when I refreshed dashboard I got the expected results.
I’m sure there is a way how to refresh instantaneously without having to wait 12 hrs ![]()
EDIT: seems bench restart did the job ![]()
Thank you!
I am glad you did it. Please read through this.
https://frappeframework.com/docs/user/en/basics/what-is-frappe#realtime
You can put a hook on events of the document you are showing data for and when ever a new document is create a real time notification can be push through this ans you can refresh the graphs when needed instead of putting a refresh loop.
I want to create 4 charts in a single dashboard.
Is it possible to have a single filter set for all 4? ie, if I select project - all four charts should change.
How to achieve this using custom app ?
This is through custom app.
But what are the changes ? like what should i add in hooks.py and what should be the filename and filepath ?
No need for hooks. Create new dashboard chart source and select your custom app module to make it part of the app. Then use that source in your charts
Okay got it Thanks
hello i want to show two bar graph in single chart from sale invoice and purchase invoice doctype . pls suggest me how i can do this
Hello @rajat1 and welcome to the community.
Have a look a this tutorial where I display 2 bar charts [Tutorial] Script Report / Chart