Hello all
This tutorial is meant to help you get to a working Script Report / Script Chart as quickly as possible and to then build more complex features on that.
It’s not intended for seasoned developers, but the average power-user or SME business owner who want’s to do more than just configure their ERP system via the GUI. Although I’m not a developer myself, the below content and insights were gained from trial-and-error and many hours spent reading this Forum. The coding is of such a nature that you simply have to add single lines or small sections of code to preexisting templates, making it fairly easy to follow along and eventually create your own reports. In the process you’ll learn a bit about Python and JavaScript, just enough to become dangerous! ![]()
It’s also specifically for v13. From v11, ERPNext uses the Frappe Datatable, which replaces the former SlickGrid, to define and render reports. Hence many of the older code snippets on the Forum does not work because the invocation syntax of the various methods have changed, even though they are very similar.
-
The official documentation (Script Report and Script Report) is very sparse, and frankly, borderline useless.
-
In contrast, the Frappe Datatable (Frappe DataTable - A simple, modern datatable library for the web) and Charts (Products at Frappe) documentation is very good, however the information is not readily usable to a beginner. As a general observation, the code examples are in the library’s native JavaScript, while the scripts to define a report / chart is to be provided in Python.
-
It’s also worthwhile to have a look at the Script API (Script API).
Script Reports can only be created by an Administrator while in Developer Mode.
The report / chart we’ll build is based on static data, not data from a specific Module or DocType, which allows everyone to complete this tutorial without any additional configuration or data. However, once we have a working report / chart, then we’ll replace the static data with data from the User DocType which is part of the Core Module. Hence we’ll define our Script Report to belong to the User DocType.
We’ll create a “Standard” Script Report which, to my mind, means it’s defined in it’s entirety in files on the file-system with nothing persisted in the database. And if something happens to be saved to the database, then the contents of the files supersedes it anyhow. Since all the metadata and scripting logic of the report / chart is saved in files, access to the server’s file-system is mandatory in order to participate in this tutorial.
So, let’s start
-
Type
new repin the awesome-bar > selectNew Report -
Before we define anything a few words on what is needed to create a Script Report. The purpose of three of the four mandatory fields, Report Name, Is Standard and Report Type, are obvious. However, although mandatory, the Ref DocType is not used at all in defining a Script Report. It’s only used to determine the Module should no Module be specified. So it’s absolutely fine to specify a Ref DocType such as User and Module such as HR or leave it blank to default to the User DocType’s module which is Core. Bear in mind that Core does not have an entry on the Modules list, whereas HR does and you could define your report to appear there. In either case your report will be accessible from the Report List or awesome-bar.
Provide the following and click Save:Report Name :
Script Report Tutorial
Ref DocType :User
Is Standard :Yes
Report Type :Script Report

-
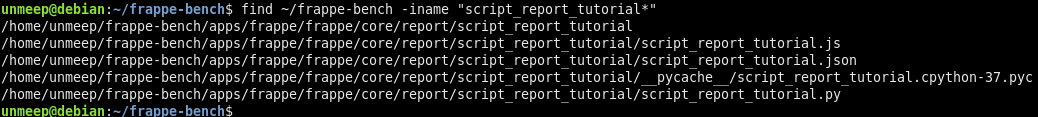
Find the newly created directory and file templates on your server’s file-system with the following CLI command:
find ~/frappe-bench -iname "script_report_tutorial*"
-
Note that 4 files were created, including:
4.1. a .json containing the report configuration metadata
4.2. a .js and a .py containing the scripting logic -
Note that the directory is in
.../frappe-bench/apps/frappe/frappe/core/report/This is where the Core module’s report definitions live, irrespective of the DocType such as User in this case. For another Script Report based on say the HR module, the directory will be in.../frappe-bench/apps/erpnext/erpnext/hr/report/. Notice that the Core module is part of the Frappe app and the HR module part of the ERPNext app. -
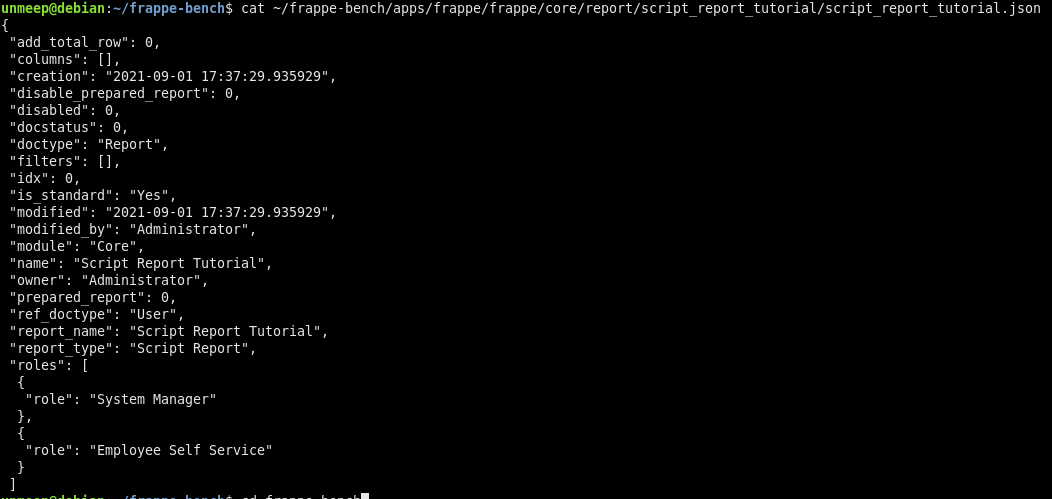
View the metadata of the newly created report in the json file with this CLI command:
cat ~/frappe-bench/apps/frappe/frappe/core/report/script_report_tutorial/script_report_tutorial.json
-
Note that all the configuration detail we provided in step 2 above is contained in this file. You can edit and save the configuration in this file should you wish to do so, provided you invoke
cd ~/frappe-bench/; bench restartto ensure your modifications are picked up. A consequence of the report being declared to be “Standard” is that the metadata in this file supersedes the definitions in the GUI form view of the report.
PS: Not entirely true, theadd_total_rowsetting in the .json file has no impact and the only place to set this is in the GUI. -
Just like a custom DocType, a custom Script Report is by default searchable in the awesome-bar: start typing
tutand you should find the report. -
To get an overview of all the reports on your system, suffix the URL with
.../app/reportor simply typereport listinto the awesome-bar.
Static data: .py file
To make it as easy as possible, and to assist learning, we’re not going to use data from the User DocType as yet, but very elementary static data. Later we’ll enhance our report to access data from the User DocType.
-
Open the script_report_tutorial.py file in your favorite script editor.
-
Amend the script to reflect the following:
def execute(filters=None):
    columns = ["Letter","Number"]
    data = [['c',2],['a',2],['t',8],['s',7]]
    return columns, data
-
Save the file.
-
Go to the Script Report Tutorial (search
tutin the awesome-bar) and click Show Report. Well done on creating your first Script Report!
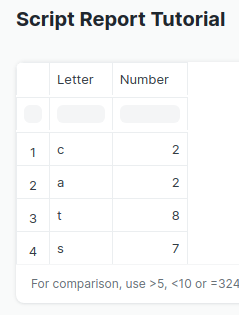
- Play with the column Sorting and Filters.
- Click on the column heading to activate the sort order functionality.
- Apply text and use the operators, as indicated at the bottom of the report, to the filter boxes below each heading. Note that the filter on the Number column does not work as it does on the Letter column since it’s by implication of fieldtype Int. We have to prefix “=” to filter for a specific value.
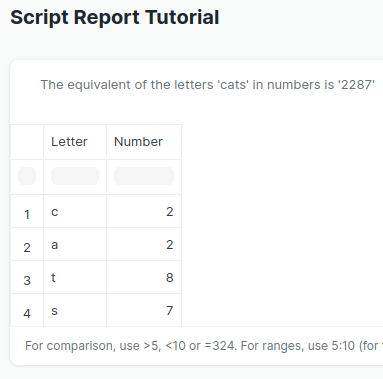
- To add a message to the report, we augment the .py file by adding the following
messagevariable to the execute function and include it in the return statement. Note that the order in which you return thecolumns,dataandmessageparameters is crucial for correct execution.
message = ["The equivalent of the letters 'cats' in numbers is '2287'"]
return columns, data, message
-
Any amendments to the .py should be picked up automatically, provided you either reload the page using the browser’s reload / hard reload button or the ERPNext > User Icon > Reload. I do find on occasion that a reload is not sufficient, for what reason I do not know, in which case I have to invoke
cd ~/frappe-bench/; bench clear-cache
or evencd ~/frappe-bench/; bench restart -
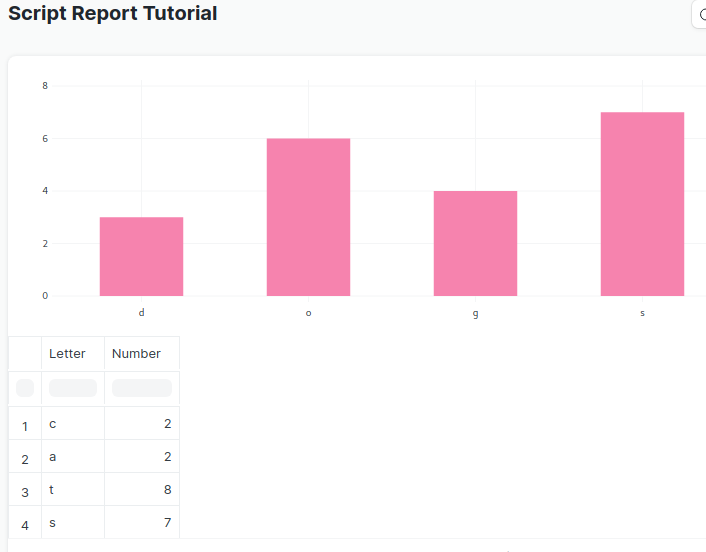
To add a chart, we once again augment the .py file with a
chartvariable. This time, we opt not to include the message. In order to retain the correct sequence of the returned parameters, we have to return a[]orNoneinstead of the message.
chart = {'data':{'labels':['d','o','g','s'],'datasets':[{'values':[3,6,4,7]}]},'type':'bar'}
return columns, data, None, chart
-
Okay, we’ve successfully created both a report and a chart. Easy as pie!

We’ve achieved our overarching objective in just a few steps with minimal scripting. Next we’ll build on this rudimentary script to add more features. Go through each line of code and make sure you understand it’s impact. -
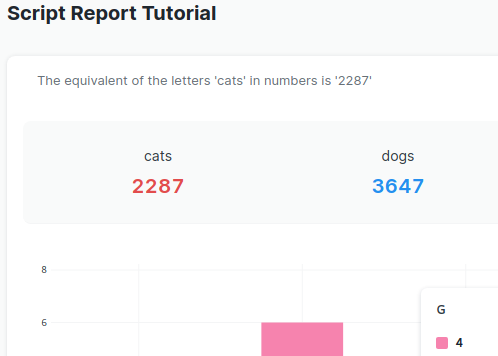
To add a report summary, in fact 2 side-by-side summaries, we augment the .py file with:
report_summary = [
    {"label":"cats","value":2287,'indicator':'Red'},
    {"label":"dogs","value":3647,'indicator':'Blue'}
]
return columns, data, message, chart, report_summary
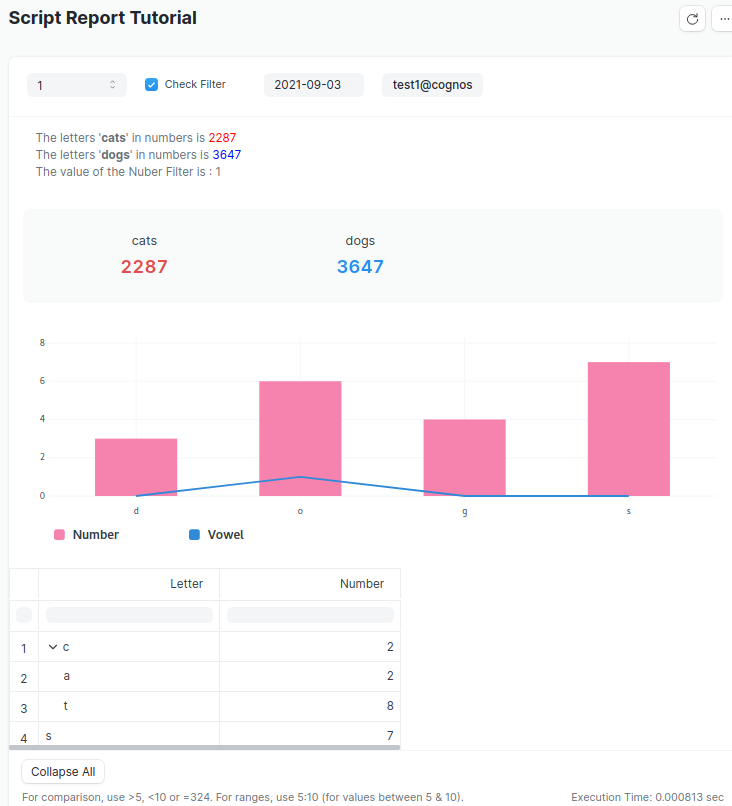
- We also add a bit of mascara and lipstick (HTML/CSS) to our rather dull message. For a screenshot of all the following amendments, please view the image at Static data: .js file step 6.
message = [
    "The letters '<b>cats</b>' in numbers is <span style='color:Red;'>2287</span>",
    "<br>",
    "The letters '<b>dogs</b>' in numbers is <span style='color:Blue;'>3647</span>"
]
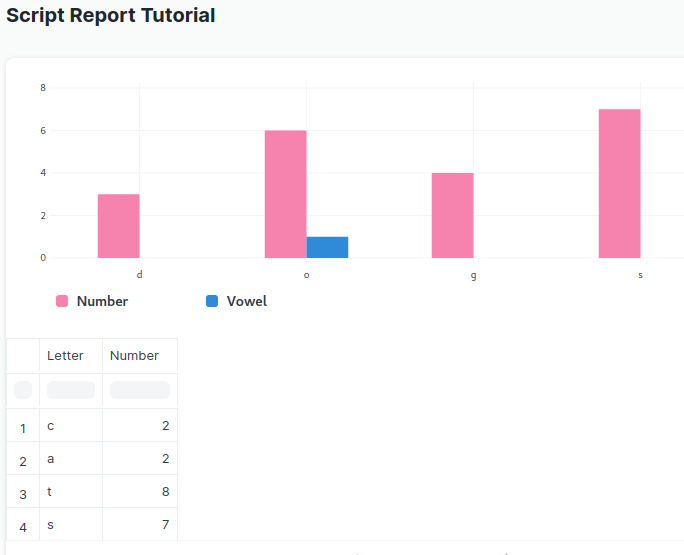
- Let’s add a second data set to our chart, being an indicator whether the letter is a vowel or not, also shown as a bar. Note that, unlike for the above single data set, a legend is automatically displayed, indicating which color represents which data set.
chart = {
    'data':{
        'labels':['d','o','g','s'],
        'datasets':[
            {'name':'Number','values':[3,6,4,7]},
            {'name':'Vowel','values':[0,1,0,0]}
        ]
    },
    'type':'bar'
}
- But what if we want to show the Vowel as a line and not a bar on the chart? Well, then we have to restructure each data set to indicate which type it is, and define the chart type as a whole as
axis-mixed.
chart = {
    'data':{
        'labels':['d','o','g','s'],
        'datasets':[
            #In axis-mixed charts you have to list the bar type first
            {'name':'Number','values':[3,6,4,7],'chartType':'bar'},
            {'name':'Vowel','values':[0,1,0,0],'chartType':'line'}
        ]
    },
    'type':'axis-mixed'
}
- To add formatting to the data grid, we have to change the
columnsvariable from a list of character strings to a list of dictionaries. A list contains comma separated elements, whereas a dictionary contains comma separated key:value pairs. However, as is in this case, the list contains dictionaries as it’s elements.
columns = [
    {'fieldname':'letter','label':'Letter','fieldtype':'Data','align':'right','width':200},
    {'fieldname':'number','label':'Number','fieldtype':'Int','align':'right','width':200}
]
- To structure the data grid as a Tree View, we have to change the nature of the
datavariable, similar to what we’ve done to the abovecolumnsvariable. Change thedatavariable from a list of lists to a list of dictionaries so we can include attributes such as the indent level.
data = [
    {'letter':'c','number':2,'indent':0},
    {'letter':'a','number':2,'indent':1},
    {'letter':'t','number':8,'indent':2},
    {'letter':'s','number':7,'indent':0}
]
- Note that the tree view works fine as long as you do not change the sort order on any of the columns. To remove the sort functionality, I found that setting
sortablehad no effect, so I simply deactivate the entiredropdown.
columns = [
	{'fieldname':'letter','label':'Letter','fieldtype':'Data','dropdown':False,'sortable':False},
	{'fieldname':'number','label':'Number','fieldtype':'Int','dropdown':False,'sortable':False}
]
- To add a Total Line at the base of the grid, which will total all the numerical (eg our Number column which is of type Int) columns by default, we have to ensure both
"add_total_row": 1,in the .json file andskip_total_row = Falsein the .py file is set. Then add skip_total_row to the return statement. Unfortunately, there’s a bug, as it does not work for DocTypes in the Core module, such as User (part of Frappe), however it does work for modules such as HR (part of ERPNext).
return columns, data, None, chart, report_summary, skip_total_row
Static data: .js file
- All of the above was achieved with Python scripting in the .py file. So now it’s time to look at the JavaScript file. Open the script_report_tutorial.js file in your favorite script editor. In this file we’ll essentially configure filters. These filters are applied dataset-wide and not per column as we saw in the above step 5. By now you should be familiar with the concept of a list of dictionaries in Python. However, we’re now editing a JavaScript file. JavaScript has similar data structures to a list and dictionary, but they go by different names, array and object respectively, and they differ slightly in the way we use them. So, we’ll define each filter as an object in the filters array. Let’s create a filter for the
numbercolumn in our data set.
"filters": [{
    fieldname: "number_filter",
    label: "Number Filter",
    fieldtype: "Select",
    //You can supply the options as a string of new-line (\n) separated values,
    //    or as an array of strings such as options: ["1","2","3","4","5","6","7"],
    options: "1\n2\n3\n4\n5\n6\n7",
    default: 3
}]
-
Save this file and ensure it replaces the current version of it in the cache by invoking any of the methods we discussed above, such as a browser reload or even bench restart.
-
View the placement of the filter right at the top-left of the form. However, right now the filter has no effect on anything as yet. Let’s change that. In the .py file, add the following code below the line where we initially assign the
messagevariable with it’s list of strings. Note that we’re not editing the existing messages list, although we could do that, but appending to it.
message.append("<br>The value of the Number Filter is : " + filters.get("number_filter"))
- So, now that we know how to access the filter, let’s use it to filter the cats data set. Add the following code below the line where the
datavariable is initially assigned it’s values, as a list of dictionaries. This code creates a new list variable of the same name,data, by retaining only dictionaries which has an attribute ofnumberwith a value greater than the filer’s value. Also note that we are accessing the filter differently asfilters.number_filterand not with the.get()method as above. The choice is yours, but I prefer thegetmethod.
data = [dic for dic in data if dic["number"] > int(filters.number_filter)]
-
Save this file and reload the cache to see how a filter value of 1 is the only option which shows all 4 letters in the data grid.
-
Below is a collection of interesting filters. Try to include them in the array of filters in the .js file, remembering to separate each object with a comma. For the absolute beginner, it might be insightful to add them one by one so you can see the effect of each as you learn what the code does.
{
    fieldname: "check_filter",
    label: "Check Filter",
    fieldtype: "Check",
    default: 1,
}
{
    fieldname: "date_filter",
    label: "Date Filter",
    fieldtype: "Date",
    //Note the following default attribute, which contains an API call
    default: frappe.datetime.get_today()
}
//Note the fieldtype which links to the User DocType, as defined in the options attribute.
//Also, the reqd attribute which causes this filter selection to be mandatory before the report / chart renders.
{
    fieldname: "user_filter",
    label: "User Filter",
    fieldtype: "Link",
    options: "User",
    reqd: 1,
}
Dynamic data: Single table
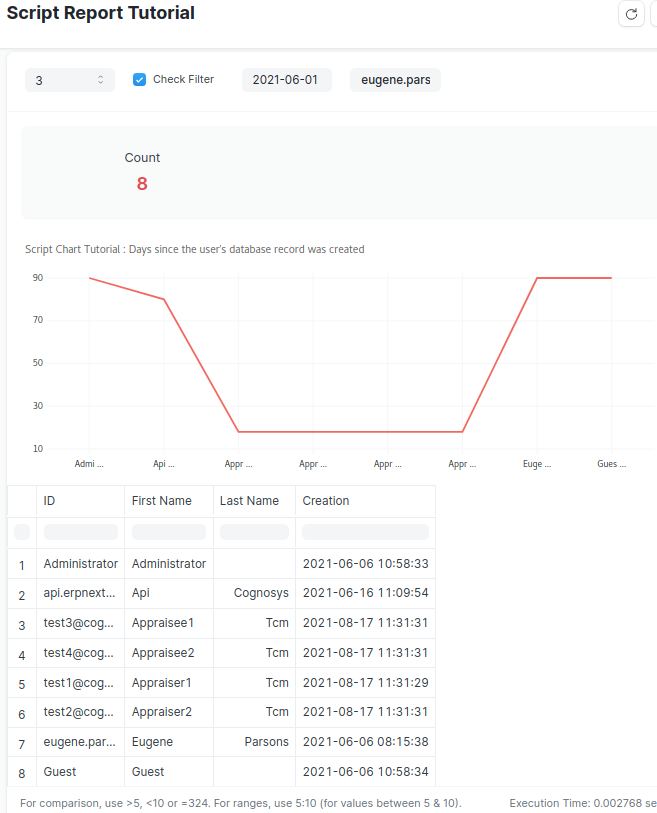
- It’s time to amend our script to access real-time, in-production data from the User DocType. Replace the entire contents of the .py file with the following, including the initial import statements. Note that since we access the database directly, the “ID” field is actually the “name” column. Furthermore, we have access to columns which are not ordinarily exposed in the GUI as fields, such as the record’s
creationdate and time.
import frappe
import datetime
def execute(filters=None):
    #frappe.msgprint("<pre>{}</pre>".format(filters))
    columns = [
        {'fieldname':'name','label':'ID','fieldtype':'Data'},
        {'fieldname':'first_name','label':'First Name','fieldtype':'Data'},
        {'fieldname':'last_name','label':'Last Name','fieldtype':'Data'},
        {'fieldname':'creation','label':'Creation','fieldtype':'Date'}
    ]
    data = frappe.db.get_all('User', ['name','first_name','last_name','creation'])
    frappe.msgprint("<span style='color:Red;'>Once this popup has served it's purpose, then comment out it's invocation, viz. #frappe.msgprint...</span><br><br>" + "<pre>{}</pre>".format(frappe.as_json(data)))
    datefilter = datetime.datetime.strptime(filters.date_filter,"%Y-%m-%d").date()
    today = datetime.datetime.now(tz=None).date()
    data = [dic for dic in data if dic.creation.date() > datefilter]
    data = sorted(data, key=lambda k: k['first_name'])
    chart = {
        'title':"Script Chart Tutorial : Days since the user's database record was created",
        'data':{
            'labels':[str(dic.first_name) + " " + str(dic.last_name) for dic in data],
            'datasets':[{'values':[(today - dic.creation.date()).days for dic in data]}]
        },
        'type':'line',
        'height':300,
        'colors':['#F16A61'],
        'lineOptions':{'hideDots':0, 'dotSize':6, 'regionFill':1}
    }
    report_summary = [{"label":"Count","value":len(data),'indicator':'Red' if len(data) < 10 else 'Green'}]
    return columns, data, None, chart, report_summary
-
There’s no need to amend the .js file. Save the changes to the .py file and reload. Note that the
frappe.msgprintAPI call will cause a popup to display the data returned from the database. The intention of this is to familiarize you with the nature of the data, in this case a list of dictionaries (strictly not true as it is JSONified). Since you already know how to work with data structures such as a list and a dictionary, the rest of the code should hopefully make more sense.
By un-commenting (deleting the ‘#’) thefrappe.msgprint("<pre>{}</pre>".format(filters)), being the first line of code within the execute function of the .py file, you’ll be able to investigate the filters variable, but also notice that a filter with areqdattribute requires a value before thisexecutefunction executes. Furthermore, notice that we have not JSONified the output this time. -
Apply the Date Filter to the creation date of both the grid and the chart. You might have to go back a week or so until you have sufficient data to display. The further back in time you go the more data you’ll receive, and once you have 10 or more records the count will turn green.
-
Note that the grid and chart displays are related to the same data set,
data, unlike in the previous cats and dogs data sets. Unfortunately we cannot have multiple (related or unrelated) grids / charts other than what we’ve done with cats and dogs. On a related note, you cannot only have a chart without a grid, i.e.return None, None, None, chartdoes not work. -
Note that the
dotsizeattribute has no effect, which might be indicative of a bug or me not understanding how to use it
Dynamic data: Multiple tables
-
The above
frappe.db.get_allAPI call is fine for accessing a single table’s data. However, in order to join data from multiple tables, we have to use yet another coding language called SQL. For this we have to usefrappe.db.sql. In fact we are going to use frappe.db.sql twice in the below code segment. First to join data from theUserandUser Typetables, specifically to find the Owner of the User Type. Then secondly to extract all the activities incurred by each user from theActivity Logtable. We cannot join the activity log data in the same way we join the user type data, since we’re going to build a hierarchy (tree view) of all the activities by each user, and that we’ll do in Python once we have both datasets. This very same approach can be followed for any parent - child DocType combination. In order the define the hierarchical indent level of each row of data, we have to add theindentattribute to each row, both the parent row and for each child row. -
We need to replace the current
executefunction by either commenting it out in it’s entirety, or simply just renaming it tosingle_executeso that it does not get invoked automatically. Then copy the following execute function to the bottom of the file.
def execute(filters=None):
	#frappe.msgprint("<pre>{}</pre>".format(filters))
	columns = [
		{'fieldname':'name','label':'Name'},
		{'fieldname':'full_name','label':'Full Name'},
		{'fieldname':'user_type','label':'User Type'},
		{'fieldname':'owner','label':'Owner'},
		{'fieldname':'subject','label':'Subject'},
		{'fieldname':'status','label':'Status'},
		{'fieldname':'creation','label':'Creation'}
	]
	data = []
	parent = frappe.db.sql("SELECT t1.name, t1.full_name, t1.user_type, t2.owner FROM `tabUser` AS t1 JOIN `tabUser Type` AS t2 ON t1.user_type = t2.name", as_dict=1)
	#frappe.msgprint("<pre>{}</pre>".format(frappe.as_json(parent)))
	for dic_p in parent:
		dic_p["indent"] = 0
		data.append(dic_p)
		#frappe.msgprint(dic_p["name"])
		child = frappe.db.sql("SELECT subject, status, creation FROM `tabActivity Log` WHERE user = '" + dic_p["name"] + "'", as_dict=1)
		#frappe.msgprint("<pre>{}</pre>".format(frappe.as_json(child)))
		for dic_c in child:
			dic_c["indent"] = 1
			data.append(dic_c)
	return columns, data
-
Note that the tree view works fine as long as you do not change the sort order on any of the columns. I presume the
treeView: trueattribute will solve this but I do not know where and how to set it The
The treeViewand all of it’s related attributes, such asname_field,parent_fieldandhas_value, we read about on this forum might be remnants of the former SlickGrid? -
The second SELECT invocation, which supplies the
childvariable with it’s data, contains a WHERE clause. A WHERE clause is used to filter the data during the extraction from the database. The condition we’ve applied to the WHERE is to return only data related to a specific individual user, namelydic_p["name"]. -
I’ve commented out all the
frappe.msgprintinvocations, however you’re welcome to un-comment them to investigate the data assigned to the respective variables. Please feel free to add your ownfrappe.msgprintstatements wherever you deem necessary to investigate the data. -
An alternative to printing the variable’s data after the SQL statement executed is to run the SQL statement in
bench mariadb. This allows you to build the SQL statement until it’s error free and then add it to the .py file. Note that we cannot simply copy the second SQL statement tobench mariadbas it contains a variable reference,dic_p["name"], which makes no sense outside of the .py script. In cases such as these, replace the variable with a literal name, such asAdministratorin this case. Remember to terminate the SQL statement with a semicolon,;. Once the SQL statement executed, you might have to pressPage DownorRight arrowto view a large collection of data, and eventually pressqto return to the SQL prompt. PressCtrl-Cto exit.
cd ~/frappe-bench/; bench --site site1.local mariadb
SELECT t1.name, t1.full_name, t1.user_type, t2.owner FROM `tabUser` AS t1 JOIN `tabUser Type` AS t2 ON t1.user_type = t2.name;
SELECT subject, status, creation FROM `tabActivity Log` WHERE user = 'Administrator';
- Other useful statements while investigating and building your SQL, are
SHOW tables;
DESC tabUser;
SELECT * FROM tabUser;
- We did not apply any filters to the data, either as part of the SQL at the time of extraction from the database, or as part of the Python code, however, in practice it’s a good approach to do so in the SQL WHERE clause so that we’re not returning the entire table of data to our front-end.
Dynamic data: Working with filters
-
Now finally, let’s incorporate filters into our report. This is a little more technical, and I’ve run into problems myself. Due to my limited coding skill, this report is working but still needs refinement, lots of it. It’s not intended to be a functional report other than trying out a few filters.
1.1. A User filter which is visible if the user is a member of the Administrator or System Manager role, otherwise hidden and it’s value defaults to the logged-in user.
1.2. A Subject filter ofMultiSelectListtype, with it’s options built dynamically subject to the value of the User filter. Unlike other filters, we cannot simply link it to a table since we do not want the primary key to be the options, but thesubjectcolumn, hence we have to build the list of options programatically.
1.3. Two date filters, with coding to ensure they work correctly. -
Copy the following to your .js and .py files.
frappe.query_reports["Script Report Tutorial"] = {
	"treeView": true,
	"name_field": "name",
	"parent_field": "name",
	"initial_depth": 1,			//The level to which the initial rendering will expand to
	//onload: function () {
		//var filter = frappe.query_report.get_filter("name_filter");
		//if (frappe.user.has_role("Administrator") || frappe.user.has_role("System Manager")) {
			//filter.set_input("Goofy");
		//} else {
			//filter.set_input(frappe.user.name);
		//};
		//filter.refresh();
		//frappe.query_report.refresh();
	//},
	"filters": [
		{
			fieldname: "name_filter",
			label: "Name Filter",
			fieldtype: "Link",
			options: "User",
			reqd: 1,
			default: (frappe.user.has_role("Administrator") || frappe.user.has_role("System Manager")) ? "" : frappe.user.name,
			hidden: !(frappe.user.has_role("Administrator") || frappe.user.has_role("System Manager")),
			on_change: function(query_report){
				query_report.set_filter_value('subject_filter', []);
				query_report.refresh();
			},
		},
		{
			fieldname: "subject_filter",
			label: "Subject Filter",
			fieldtype: "MultiSelectList",
			get_data: function(txt) {
				if (frappe.query_report.get_filter_value('name_filter')) {
					var name = frappe.query_report.get_filter_value("name_filter");
					return frappe.db.get_list("Activity Log", {fields: ['subject AS value', 'subject AS label', 'subject AS description'], filters: {"user": name}, distinct: 1, order_by: "subject"});
					//return frappe.db.get_link_options("Activity Log", txt, {"user":name});
				}
				else {
					return [];
				};
			},
			on_change: function(query_report) {
				query_report.refresh();
			},
		},
		{
			fieldname: "date_from_filter",
			label: "Date From Filter",
			fieldtype: "Date",
			default: frappe.datetime.add_months(frappe.datetime.get_today(), -1)
		},
		{
			fieldname: "date_to_filter",
			label: "Date To Filter",
			fieldtype: "Date",
			default: frappe.datetime.get_today()
		}
	],
};
def execute(filters=None):
	if filters.date_from_filter and filters.date_to_filter:
		if filters.date_from_filter > filters.date_to_filter:
			frappe.throw("The 'From Date' ({}) must be before the 'To Date' ({})".format(filters.date_from_filter, filters.date_to_filter))
	if filters.date_from_filter == None:
		filters.date_from_filter = "2000-01-01"
	if filters.date_to_filter == None:
		filters.date_to_filter = frappe.datetime.get_today()
	conditions = " WHERE creation BETWEEN '" + filters.date_from_filter + "' AND '" + filters.date_to_filter + "'"
	if filters.get("name_filter"):
		name = filters.get("name_filter")
		conditions += f" AND user = '{name}'"
	# if len(filters.get("subject_filter")) > 0:
		# subject = ','.join("'{0}'".format(x) for x in filters.get("subject_filter"))
		# conditions += " AND subject IN (" + subject + ")"
	columns = [
		{'fieldname':'name','label':'Name','width':'250'},
		{'fieldname':'full_name','label':'Full Name','width':'250'},
		{'fieldname':'subject','label':'Subject','width':'350'},
		{'fieldname':'status','label':'Status','width':'100'},
		{'fieldname':'creation','label':'Creation','width':'250'}
	]
	data = []
	users = frappe.get_list("User", fields=["name","full_name","'0' AS indent"], filters=[{"name":filters.get("name_filter")}], order_by='full_name ASC')
	for user in users:
		user["has_value"] = True
		data.append(user)
		activities = frappe.db.sql("SELECT subject, status, creation, '1' AS indent FROM `tabActivity Log`" + conditions, as_dict=1)
		for activity in activities:
			activity["has_value"] = False
			data.append(activity)
	return columns, data
Conclusion
There are many other enhancements you can add to either the grid or the chart, such as:
- Change the color of either the value or the background of a cell or an entire row in the grid subject to some threshold(s) in the data.
- Add advanced features such as a button in a grid cell to invoke a js/py script, eg a modal popup.
- Customizing the Tooltip on the chart
- Add an
Export to SVGbutton
As I’ve mentioned earlier, I prefer the business angle of things, however I’d appreciate developers to comment on the so called bugs and dead-ends I’ve experienced. While a competent developer might cringe at my coding, I also invite you to help me understand how to do things better, however please keep the intended audience in mind when you do so.
We have only scratched the surface, and a very particular itch. You now have the bulk of what is required to build your very own awesome Script Report / Script Chart. But, do not be fooled, as for all coding endeavors, the devil is in the detail! Happy learning.