All existing Dashboard Charts based on the document type are displayed on the page. We’ve also introduced a new DocType Number Card, which can be added to the page too!
Any Dashboard Chart or Number Card added by a user is available to only that user by default. To
make it publicly available to all users on the system (with read permission for that document type), is_public can be set for that card/chart.
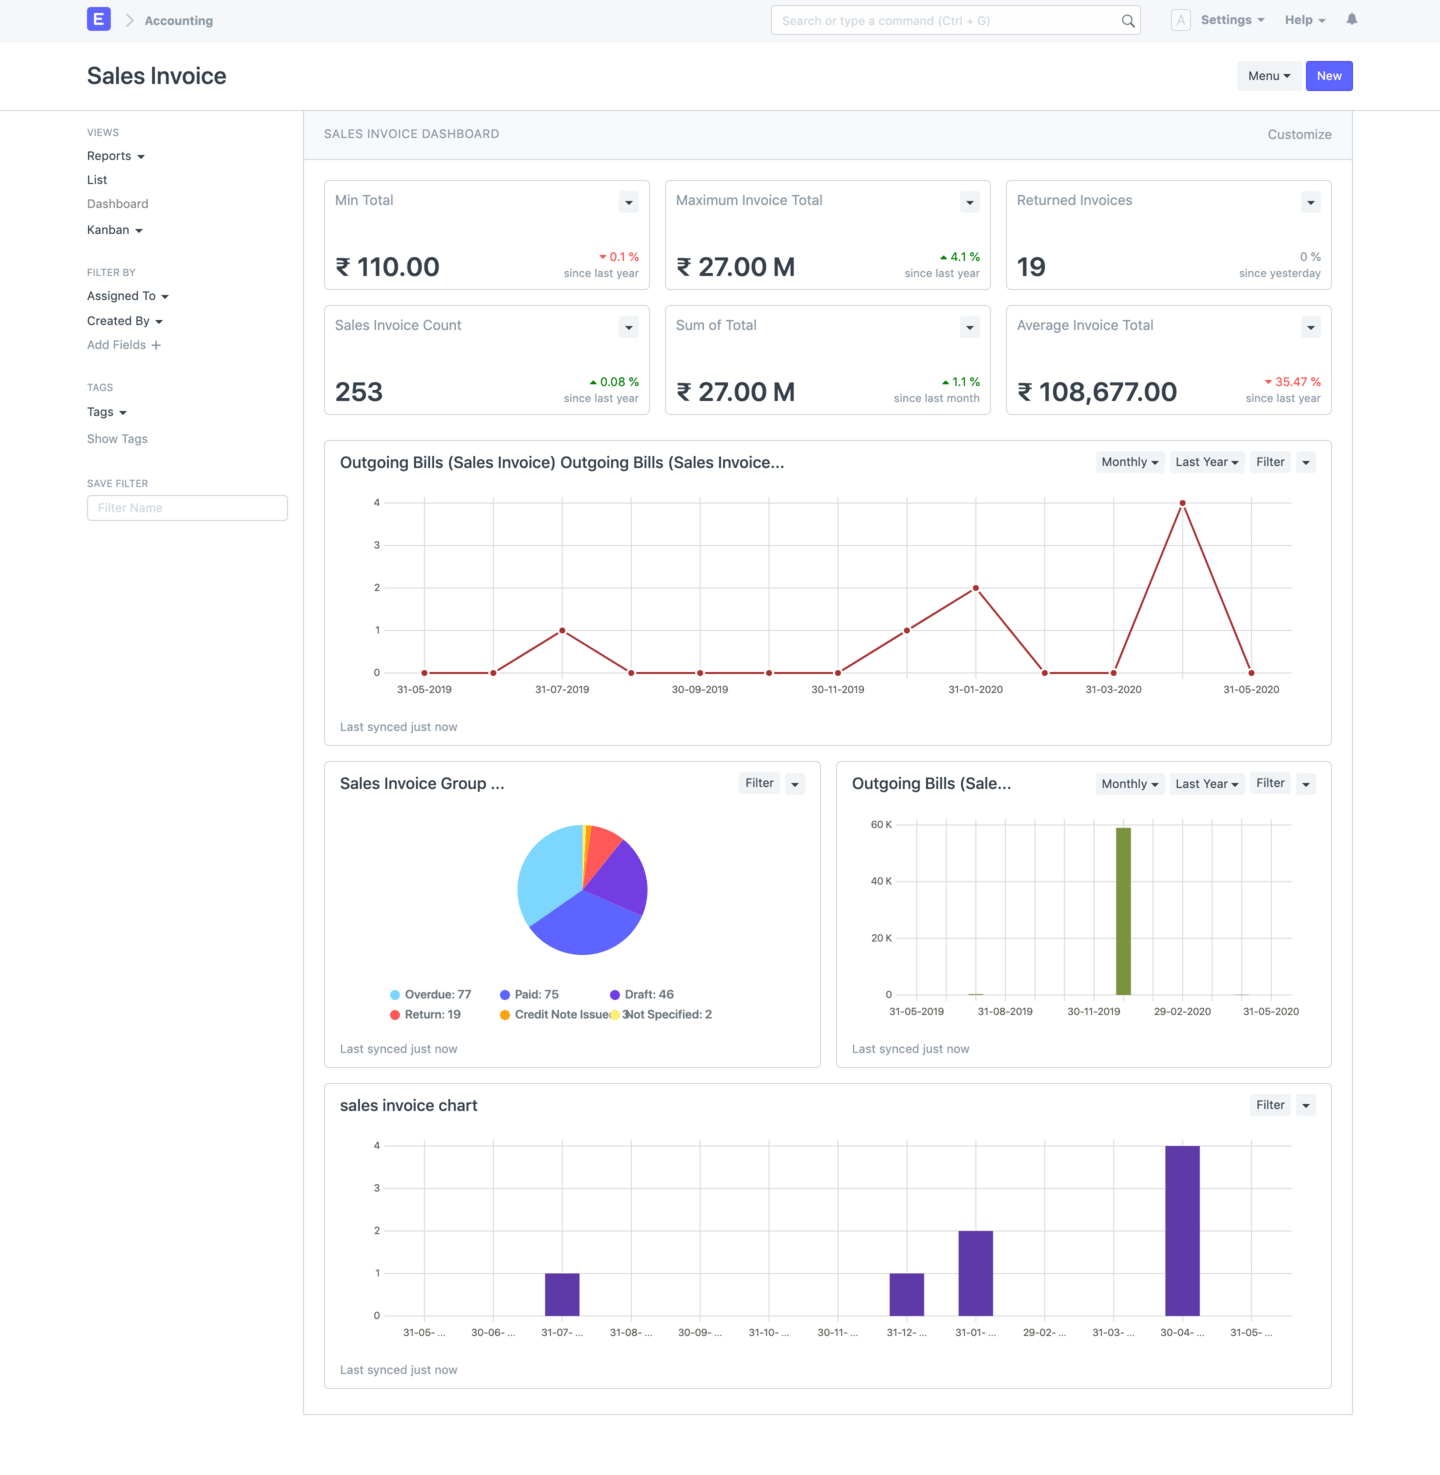
The page can be customized by clicking on Customize on the top right corner. The customizations are saved at a user level.
Here’s an example of a customised Sales Invoice Dashboard:
No matter what I do, I don’t get this thing in the sidebar. I can create a new Number Card, new chart, new Shortcut and everything, but this Dashboard view for a Doctype is just not showing up I suppose we could use a documentation. On latest develop
No probs. If you wanna test out the new features and get familiar with what’s coming, you can switch your branch to develop, or version-13-beta and roll. There are so many improvements to the UX for end users. Data makes sense now, real happy!
@iMoshi that’s strange, there’s no documentation really required, the dashboard link should show up on the list sidebar of all doctypes. Did you run bench build?
This is still not part of version-13-beta. You need to be on develop branch.
Looks really promising & cool. Will it auto refresh on load else you need to load each one of them manually which will be a turn-off for such a cool feature.
This is exactly the feature I contemplated the last days. Should have checked the forum first.
Great stuff
Next improvements could be:
Enable filters, like for listview. For example, i’d like to view the Sales Invoice charts filtered by customer = 'Customer Pvt. Ltd' and currency = 'EUR' and base_grand_total > 1000.
Make charts navigable and apply the selected slice as a filter. For example, if I select the data point for 2019-07-31 in the “Outgoing Bills” chart, the other charts should only show data for this specific date.
This looks great. Got one question though… Do the Charts and Number Cards work according to user permissions? For example, let’s say User A has permission to view all Sales Invoices and User B can only view Sales Invoices created by him. Let’s also assume that total value of all invoices is $1,000,000 while total value of invoices created by User B is $100,000
If we have a Number Card that shows total value of all invoices with is_public checked, will User A see $1,000,000 while User B sees $100,000?