Hello!
For about a month we are using ERPNext in our company. I am taking care of the server.
It is a standalone Ubuntu Server 18.04 LTS. 4 cores i5, 8gb ram, 2x 240gb SSD disk software RAID-1 with mdadm. ERPNext and Frappe is Master branch, and we are on production.
Almost everything works well, besides a couple of minor problems.
First, anywhere in ERPNext the progress bar is not showing up. During the whatever is being done at the moment the website darkens and just freezes. After work being done there is a pop-up that the job is finished and website is responsive again.
Second, when ERPNext is fetching data (for example when viewing Items, click on ‘500’ to show 500 records) the whole browser card freezes, cursor stays with the same icon, whole app hangs.
Why is that?
Although my users seem to not notice it at the moment, I have worked with another instance of ERPNext (also local ubuntu server 18.04, only difference is the hard drive) and feel ERPNext is really slow and leaves a feeling of hanging all the time. It was OK with the previous instance I worked with (I installed and set up both of the instances).
I appreciate any help and additional questions.
Thanks a lot.
I have enabled the slow query log around a week ago, and there are no slow queries (I checked slow query as longer than 2 seconds).
There are however ~15% queries (16K/107K at the moment - the server was restarted yesterday) that use no indexes. It seems all of them do a Full Table Scan, but I’m not sure if this is just a normal behaviour.
For example when clicking ‘500’ in Items (to show 500 Items from 20) the website freezes completely for 3-5 seconds.
This issue wasn’t present in the same version of ERPNext on the same computer with previous install.
The progress bar was also working fine. Website was quick and very responsive, also when fetching records.
I will upload MariaDB configuration my.cnf and the slow query log.
What can I do more? Any insights? Thank you kindly in advance!
Slow query log:
    # User@Host: MY-USER @ localhost [127.0.0.1]
    # Thread_id: 7986  Schema: 6807138453007e87  QC_hit: No
    # Query_time: 0.000109  Lock_time: 0.000029  Rows_sent: 0  Rows_examined: 5
    # Rows_affected: 0  Bytes_sent: 105
    # Full_scan: Yes  Full_join: No  Tmp_table: No  Tmp_table_on_disk: No
    # Filesort: Yes  Filesort_on_disk: No  Merge_passes: 0  Priority_queue: No
    SET timestamp=1563352380;
    select name from `tabEmail Account` where `tabEmail Account`.enable_incoming = 1.0 and `tabEmail Account`.notify_if_unreplied = 1.0
                              order by `tabEmail Account`.`modified` DESC;

    # User@Host: MY-USER @ localhost [127.0.0.1]
    # Thread_id: 7987  Schema: 6807138453007e87  QC_hit: No
    # Query_time: 0.000075  Lock_time: 0.000025  Rows_sent: 0  Rows_examined: 0
    # Rows_affected: 0  Bytes_sent: 127
    # Full_scan: Yes  Full_join: No  Tmp_table: No  Tmp_table_on_disk: No
    # Filesort: Yes  Filesort_on_disk: No  Merge_passes: 0  Priority_queue: No
    SET timestamp=1563352380;
    select `tabOAuth Authorization Code`.`name` from `tabOAuth Authorization Code` where `tabOAuth Authorization Code`.validity = "Invalid"
                              order by `tabOAuth Authorization Code`.`modified` DESC;

    # User@Host: MY-USER @ localhost [127.0.0.1]
    # Thread_id: 7987  Schema: 6807138453007e87  QC_hit: No
    # Query_time: 0.000063  Lock_time: 0.000023  Rows_sent: 0  Rows_examined: 0
    # Rows_affected: 0  Bytes_sent: 115
    # Full_scan: Yes  Full_join: No  Tmp_table: No  Tmp_table_on_disk: No
    # Filesort: Yes  Filesort_on_disk: No  Merge_passes: 0  Priority_queue: No
    SET timestamp=1563352380;
    select `tabOAuth Bearer Token`.`name` from `tabOAuth Bearer Token` where `tabOAuth Bearer Token`.status = "Revoked"
                              order by `tabOAuth Bearer Token`.`modified` DESC;

    # User@Host: MY-USER @ localhost [127.0.0.1]
    # Thread_id: 7988  Schema: 6807138453007e87  QC_hit: No
    # Query_time: 0.000104  Lock_time: 0.000038  Rows_sent: 0  Rows_examined: 0
    # Rows_affected: 0  Bytes_sent: 211
    # Full_scan: Yes  Full_join: No  Tmp_table: No  Tmp_table_on_disk: No
    # Filesort: Yes  Filesort_on_disk: No  Merge_passes: 0  Priority_queue: No
    SET timestamp=1563352380;
    select name, data from `tabIntegration Request` where `tabIntegration Request`.status = "Authorized" and `tabIntegration Request`.integration_request_service = "Razorpay"
                              order by `tabIntegration Request`.`modified` DESC;

    ># User@Host: MY-USER @ localhost [127.0.0.1]
    ># Thread_id: 7991  Schema: 6807138453007e87  QC_hit: No
    ># Query_time: 0.000097  Lock_time: 0.000028  Rows_sent: 1  Rows_examined: 2
    # Rows_affected: 0  Bytes_sent: 358
    # Full_scan: Yes  Full_join: No  Tmp_table: No  Tmp_table_on_disk: No
    # Filesort: Yes  Filesort_on_disk: No  Merge_passes: 0  Priority_queue: No
    SET timestamp=1563352380;
    select name, published, start_date, end_date from `tabWeb Page`
                              order by `tabWeb Page`.`modified` desc;

    # User@Host: MY-USER @ localhost [127.0.0.1]
    # Thread_id: 7993  Schema: 6807138453007e87  QC_hit: No
    # Query_time: 0.000145  Lock_time: 0.000033  Rows_sent: 0  Rows_examined: 11
    # Rows_affected: 0  Bytes_sent: 191
    # Full_scan: Yes  Full_join: No  Tmp_table: No  Tmp_table_on_disk: No
    # Filesort: Yes  Filesort_on_disk: No  Merge_passes: 0  Priority_queue: No
    SET timestamp=1563352380;
    select daily_time_to_send, name from `tabProject` where `tabProject`.collect_progress = 1.0 and `tabProject`.frequency = "Daily" and `tabProject`.status = "Open"
                              order by `tabProject`.`modified` desc;

    # User@Host: MY-USER @ localhost [127.0.0.1]
    # Thread_id: 7993  Schema: 6807138453007e87  QC_hit: No
    # Query_time: 0.000120  Lock_time: 0.000031  Rows_sent: 0  Rows_examined: 11
    # Rows_affected: 0  Bytes_sent: 263
    # Full_scan: Yes  Full_join: No  Tmp_table: No  Tmp_table_on_disk: No
    # Filesort: Yes  Filesort_on_disk: No  Merge_passes: 0  Priority_queue: No
    SET timestamp=1563352380;
    select first_email, second_email, name from `tabProject` where `tabProject`.collect_progress = 1.0 and `tabProject`.frequency = "Twice Daily" and `tabProject`.status = "Open"
                              order by `tabProject`.`modified` desc;

    # User@Host: MY-USER @ localhost [127.0.0.1]
    # Thread_id: 7993  Schema: 6807138453007e87  QC_hit: No
    # Query_time: 0.000116  Lock_time: 0.000030  Rows_sent: 0  Rows_examined: 11
    # Rows_affected: 0  Bytes_sent: 277
    # Full_scan: Yes  Full_join: No  Tmp_table: No  Tmp_table_on_disk: No
     # Filesort: Yes  Filesort_on_disk: No  Merge_passes: 0  Priority_queue: No
     SET timestamp=1563352380;
     select day_to_send, weekly_time_to_send, name from `tabProject` where `tabProject`.collect_progress = 1.0 and `tabProject`.frequency = "Weekly" and `tabProject`.status = "Open"
My.cnf:
    #
    # * Fine Tuning
    #
    max_connections         = 100
    connect_timeout         = 5
    wait_timeout            = 600
    max_allowed_packet      = 32M
    thread_cache_size       = 128
    sort_buffer_size        = 4M
    bulk_insert_buffer_size = 16M
    tmp_table_size          = 128M
    max_heap_table_size     = 128M
    #
    # * MyISAM
    #
    # This replaces the startup script and checks MyISAM tables if needed
    # the first time they are touched. On error, make copy and try a repair.
    myisam_recover_options = BACKUP
    key_buffer_size         = 128M
    #open-files-limit       = 2000
    table_open_cache        = 512
    myisam_sort_buffer_size = 512M
    concurrent_insert       = 2
    read_buffer_size        = 2M
    read_rnd_buffer_size    = 1M
    join_buffer_size        = 4M
    #
    # * Query Cache Configuration
    #
    # Cache only tiny result sets, so we can fit more in the query cache.
    query_cache_limit       = 256K
    query_cache_size        = 0
    query_cache_type        = 0

#
# * InnoDB
#
# InnoDB is enabled by default with a 10MB datafile in /var/lib/mysql/.
# Read the manual for more InnoDB related options. There are many!
default_storage_engine  = InnoDB
# you can't just change log file size, requires special procedure
#innodb_log_file_size   = 50M
innodb_buffer_pool_size = 4G
innodb_log_buffer_size  = 8M
innodb-file-per-table   = 1
innodb-large-prefix     = 1
innodb_open_files       = 400
innodb_io_capacity      = 400
innodb_flush_method     = O_DIRECT
innodb_buffer_pool_instances    = 4
innodb_log_file_size    = 512M
innodb_sort_buffer_size = 4M
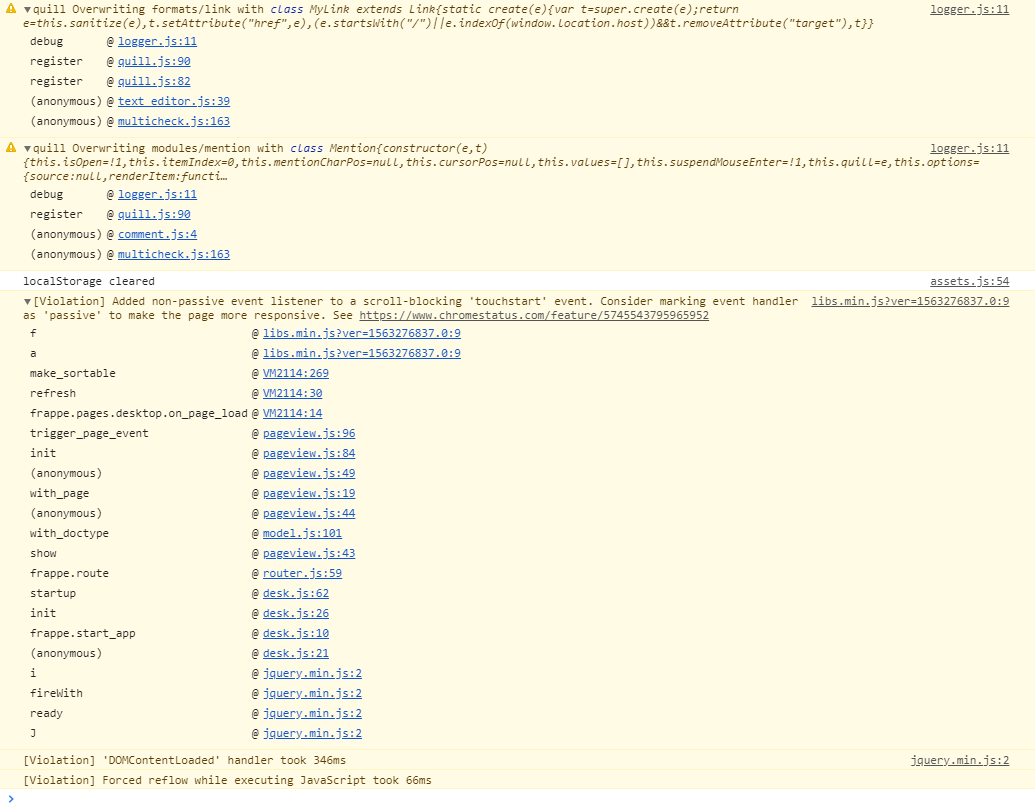
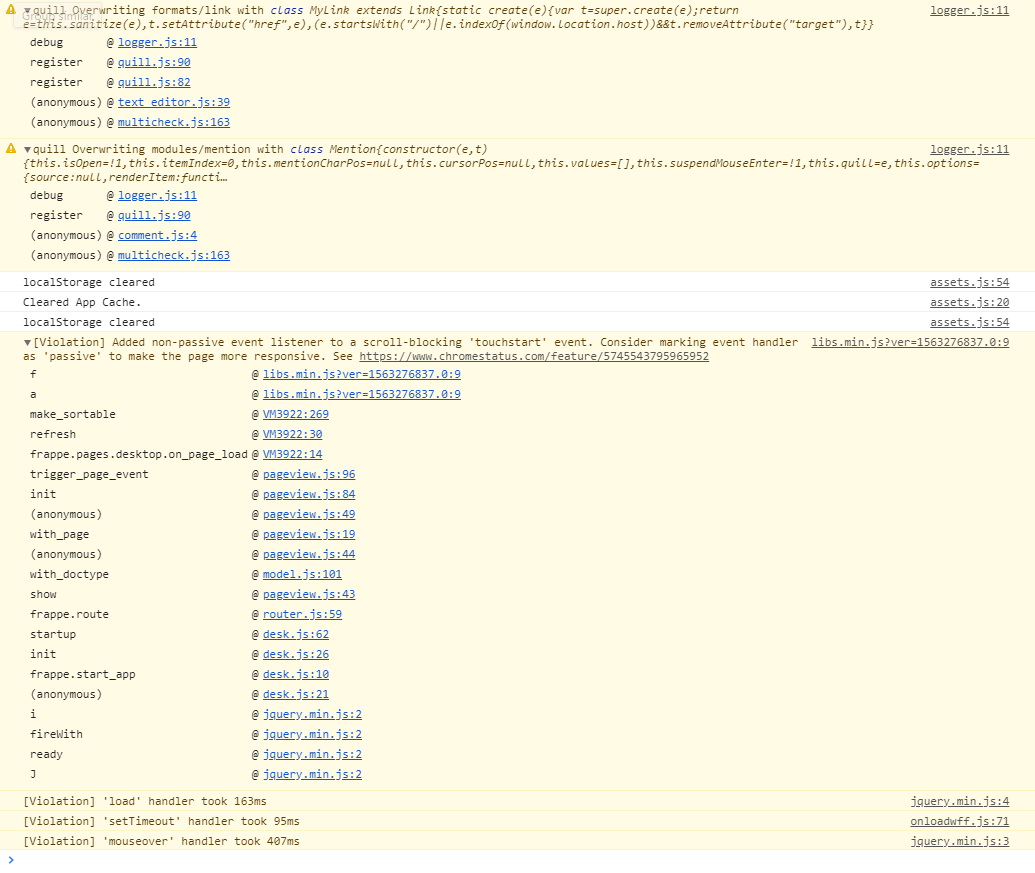
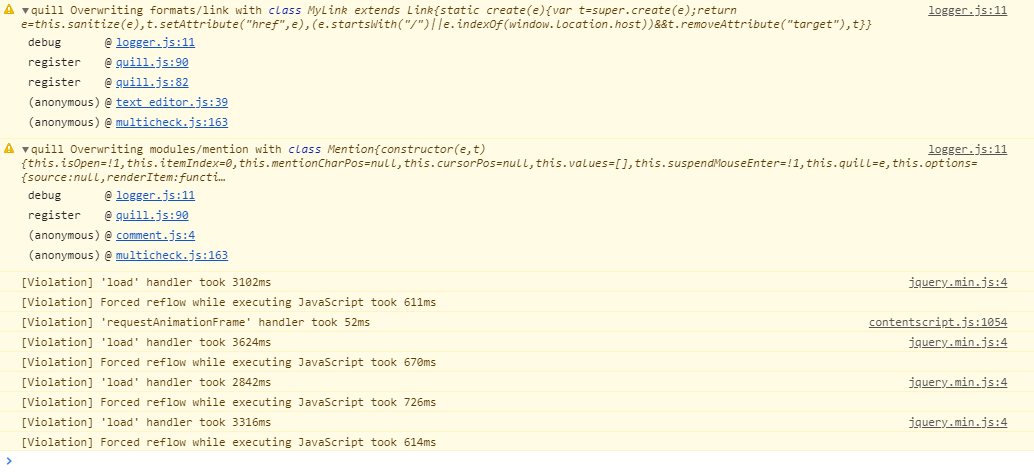
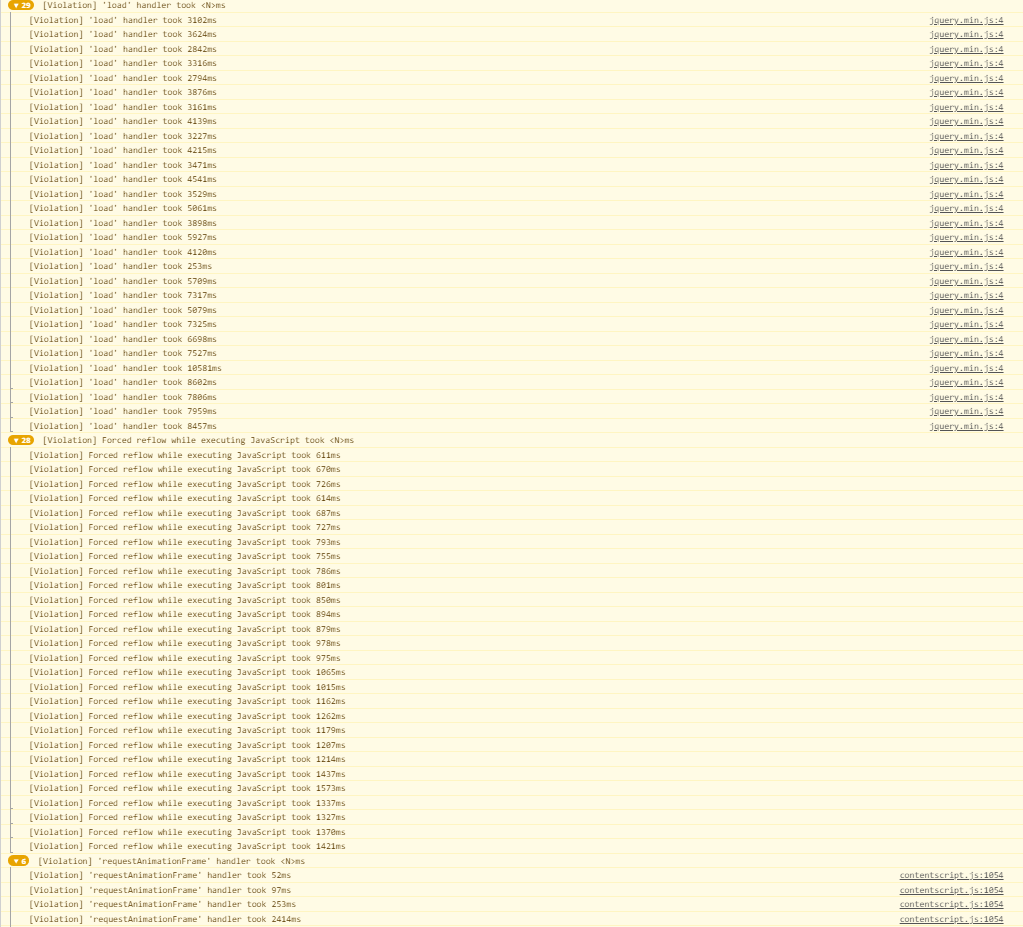
jquery ‘load’ handler is doing something at it’s own, taking 3-10 seconds each time
Forced reflow while executing JavaScript is also showing up all the time taking 0,6-1 second.
EDIT2: it may just be a refresh of Item page, when users add new records. Still, it takes 3-10 seconds for every request.
EDIT3: open ERPNext browser tabs use a lot of RAM and use some CPU all the time.