Found the solution.
The below lines of code is all that is required to make crosstab / pivot report.
sl_entries = get_stock_ledger_entries(filters, items) # coming from frappe.db.sql in get_stock_ledger_entries()
colnames = [key for key in sl_entries[0].keys()] # create list of columns used in creating dataframe
df = pd.DataFrame.from_records(sl_entries, columns=colnames) # this is key to get the data from frappe.db.sql loaded correctly.
pvt = pd.pivot_table(
	df,
	values='actual_qty',
	index=['posting_date', 'Particulars'],
	columns='item_code',
	fill_value=0
)

data = pvt.reset_index().values.tolist() # reset the index and create a list for use in report.

columns += pvt.columns.values.tolist() # create the list of dynamic columns added to the previously defined static columns
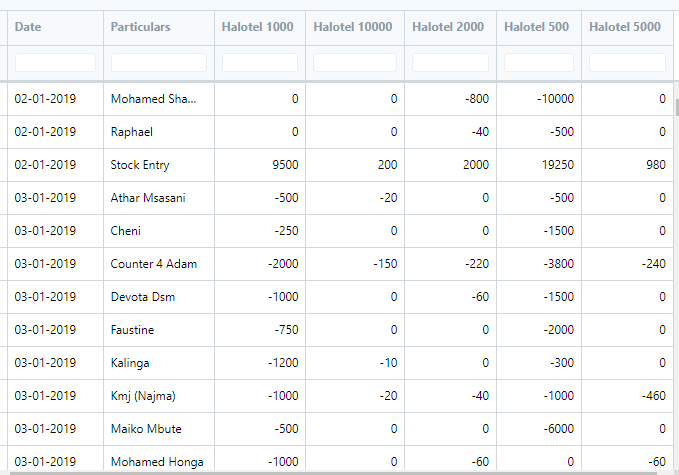
Example output from script report: