Hi All,
I have checked many video and tutorials about creating Dashboards.
I can’t get my head arround creating a custom Dashboard on our production/
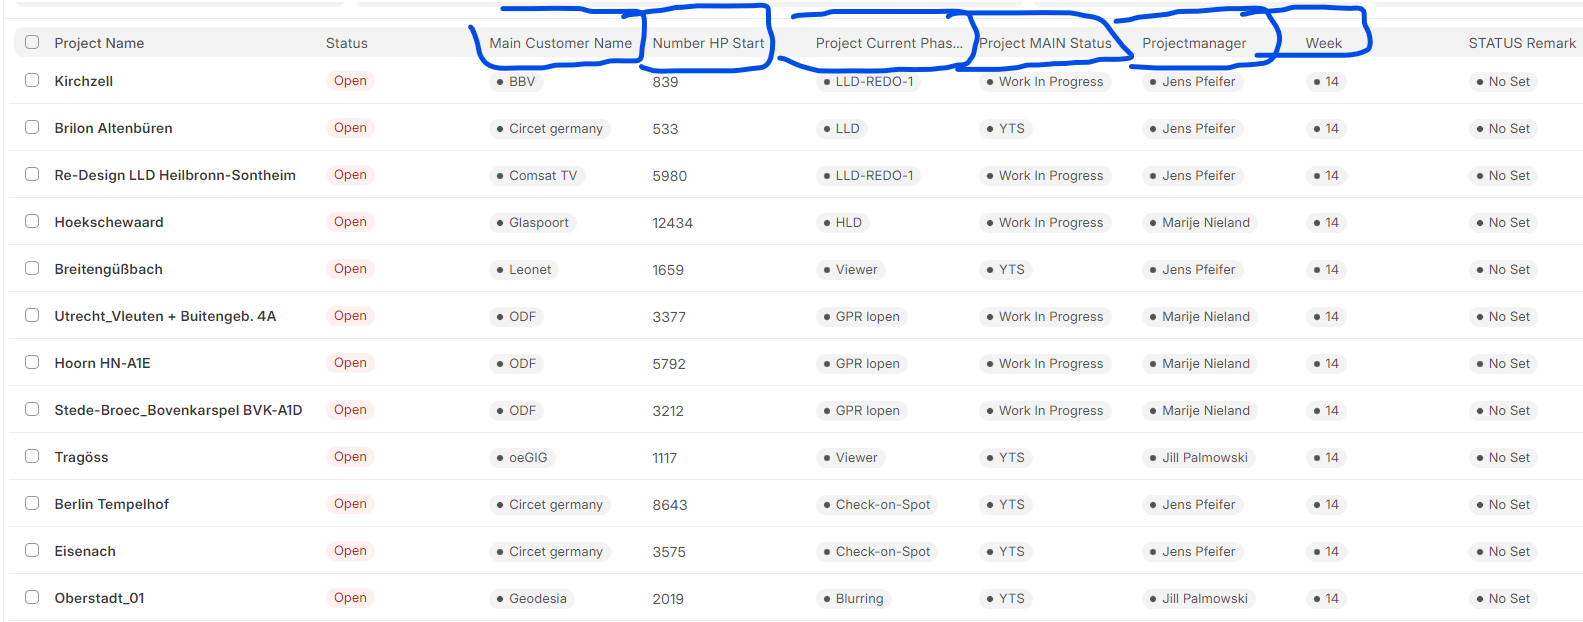
I want to create Dashboard based on for example the “Week number” (see below) and the “Main Customer” and Sum of “Number HP”.
And a Dashboard based on the “Project Main Status” and “Week Number”
And so on.
But in all the Tutorials they alway demand the Start and End date. What we mainly dont use. Any solution here sombody already solved?