Hello Team
I need some help in script reports
- How to build script report that show live charts?
- How to make report collapse rows depend on specific field?
best regards
Omar
Hello Team
I need some help in script reports
best regards
Omar
have a look at:
Thanks @JoEz
I don’t want to use HTML page i need charts in report page!! any help?
Yes I need like this but in report page.
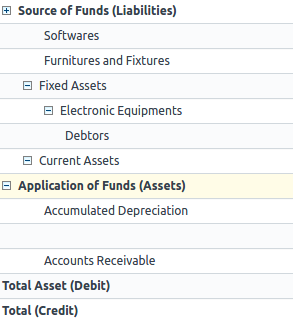
please tell me when u find this code to do collapse as shown in picture
You can create a script report, have a look at maintenance report
Thanks again @JoEz
I actually do my report
but i need collapse speed field depend on speed value like all 0.1 collapse together
you need to change the query grouping by speed instead of per date
Hi @Omar_Salah
Can you please share ur code if possible i m struggling the same issue long time with no solution
Regards
@SOLOSOFT witch one?
Shopper statistics
@SOLOSOFT If you mean Charts follow this link
note: “js file more important than others”
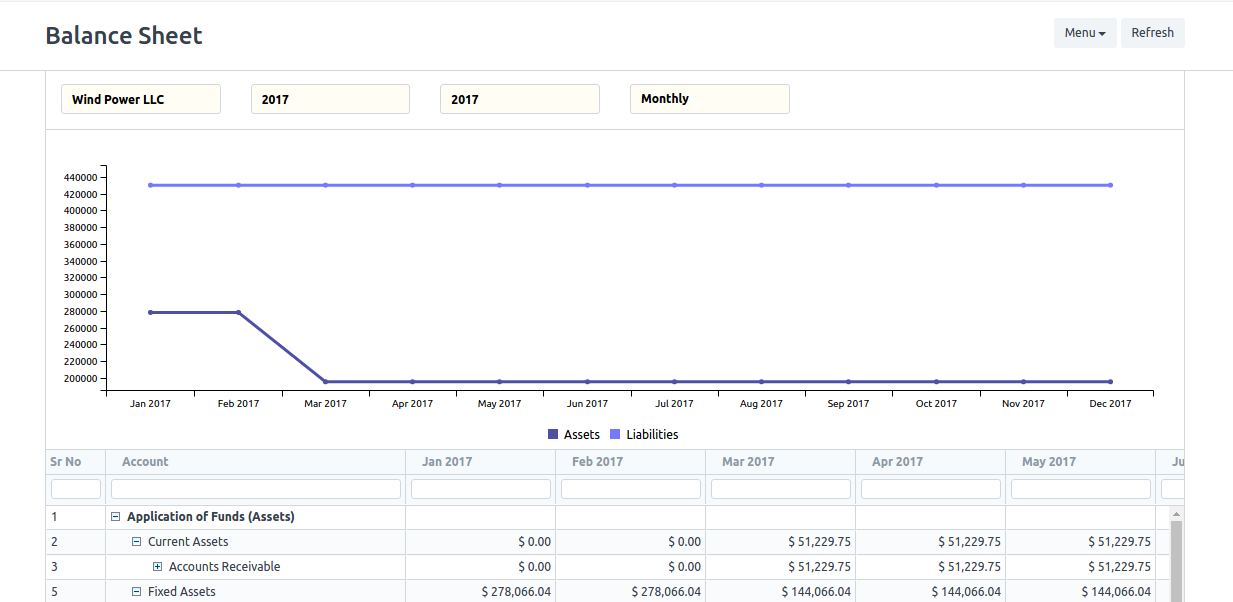
The problem is i have more than one line of chart to show i need to change sql query (turn rowns into lines)
@SOLOSOFT If you mean like this
and please if you understand this topic tell me ![]()
![]()
Where you able to figure this one out?
I believe The answer lies in the way the rows are structured.
As a tip: each row is given a specific structure and elements.
Each row also refers to the following function one directory above the python file you link, which is financial_statements.py