Dashboard figures are not changing after applying Date Range Between 1st April to till date. Please help me as i want present this dashboard to the management.
share some screen short not able to understand the issue
Dear Rehan
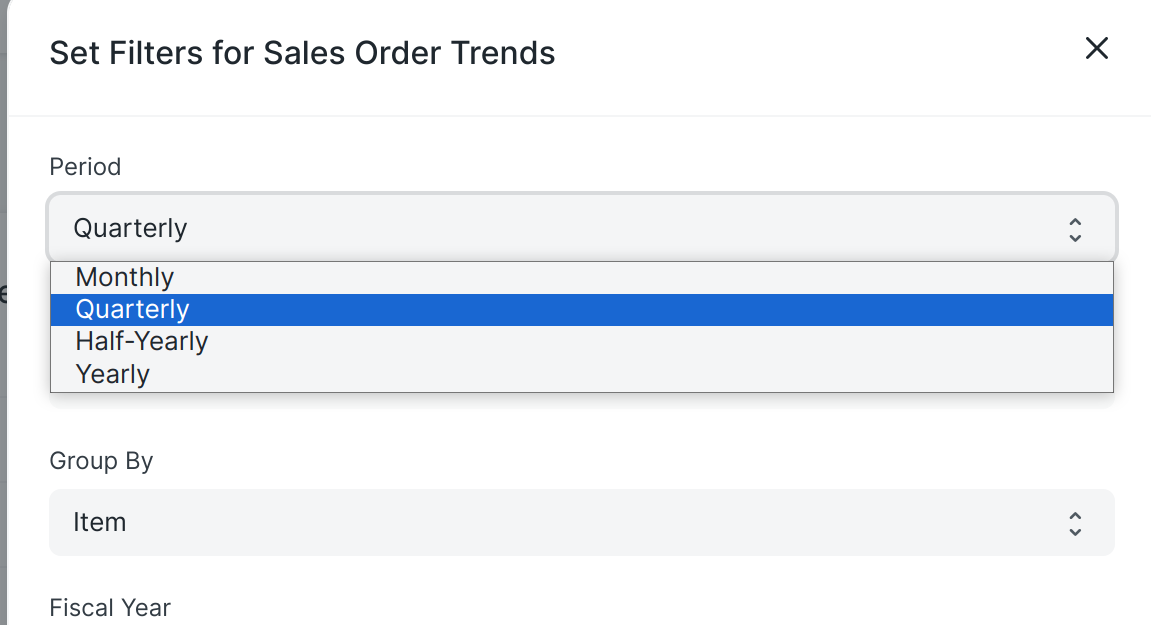
When accessing Selling Dashboard. When we applying filters say date Range between 1st April to 31st Aug. Then Dashboard figures supposed to change from current fiscal year to selected period. which is not happening.