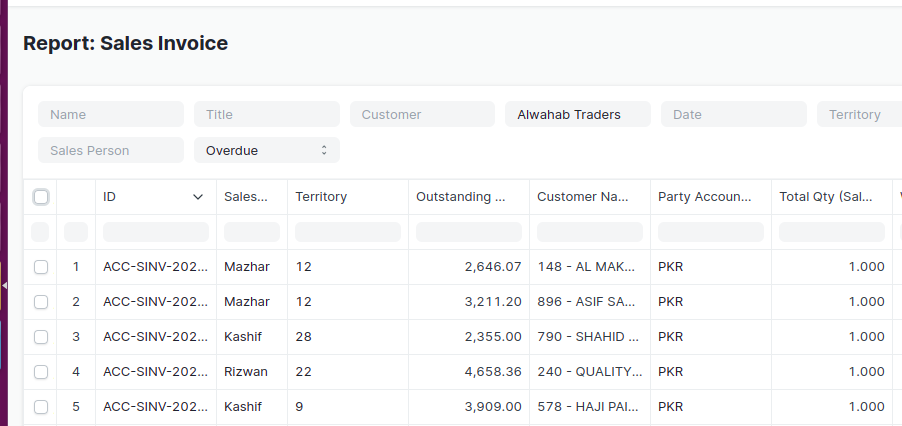
Can you explain How to achieve Selectable rows in script report. e.g
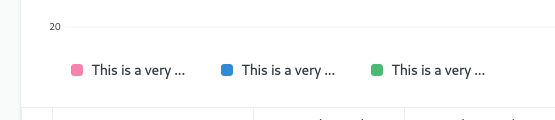
Is there any way to remove the truncated from the names of the chart-legend? Lots of wasted space.
Eugene, your document is spectacular and greatly appreciated.
This is a big long-term maintenance problem.
Have you found a way to include Script Reports into backups, for example?
A symlink into the private files directory would work, I think.
1 Like
You can store report files in your custom apps folder. Play with the “Is Standart” and “Module” settings. Then the files will be stored in your custom app’s folder.
1 Like
Yeah!
I see that that works. Thank you.
good idea
for my issue it’s work
thankyou
1 Like
How to remove or hide series no in script report…
On click of down arrow from column, you can able to remove. Or if you want permanently remove just comment the code in python file.
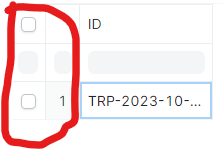
Thanks for replay. But it is default column. Not showing any arrow in that columns
@EugeneP , if I need to print some dynamic value in print template, how do you do that? Server call/Get value from DB call doesn’t work inside report html print format. I cannot pass this as either from the execute function. The only allowed ones are column, data, message, chart and report summary. Is there a way to add value to report context object that can be accessed inside html?
Hi @EugeneP,
Thanks for an excellent tutorial on Reports & Charts. Very informative, with clear examples !
1 Like
Hey, @zulfi007 ,
" The function get_datatable_options(options) generates a checkbox column. Upon clicking the ‘Get Selected’ button, it fetches data from the selected row in the report."
frappe.query_reports[‘Report Name’] = {
     onload: function(report) {
        frappe.query_report.page.add_inner_button(__(“Get Selected”), function() {
        var selectedRows = [];
         $(‘.dt-scrollable’).find(“:input[type=checkbox]“).each((idx, row) => {
              if (row.checked) {
                  console.log(“*** selected row id : ” + idx);
                  selectedRows.push(frappe.query_report.data[idx]);
              }
          });
            console.log("Selected row: " selectedRows)
      })
        get_datatable_options(options) {
                return Object.assign(options, {
                    checkboxColumn: true
                });
            }
     }
}
4 Likes
Hi, I want create custom chart in dashboard , to create graph of that month so
How can i do two chart or more in one script report
Great work! Helped out a ton.
1 Like
Hello @anilpoda
As explained in the first section of this topic, setting “Is Standard” to Yes, means that the script is persisted as a file, not as a record in the database. The rest of the topic assume you did that so that you can follow along and edit / save the file.
Also refer to What is the "Is Standard" in a Report?
Thank you for this insightfull reading, @EugeneP epsecially around the use of graphs
and lets face it, graphs does add a new dimension to data-presentation.
You cant perhaps offer some guidance on using “Coalasce” and “Round” in a sript report ? WHen I try and “import” them from pypika I get an error : import unknown ??
Once again, thank you
1 Like
Maybe confirm the package is installed in the Python virtual environment used by your bench. Use
cd “your/bench/path/” && pip list
to check package availability
Please start a new topic to ask questions about Python packages, so that we can keep this topic focused on script reporting.