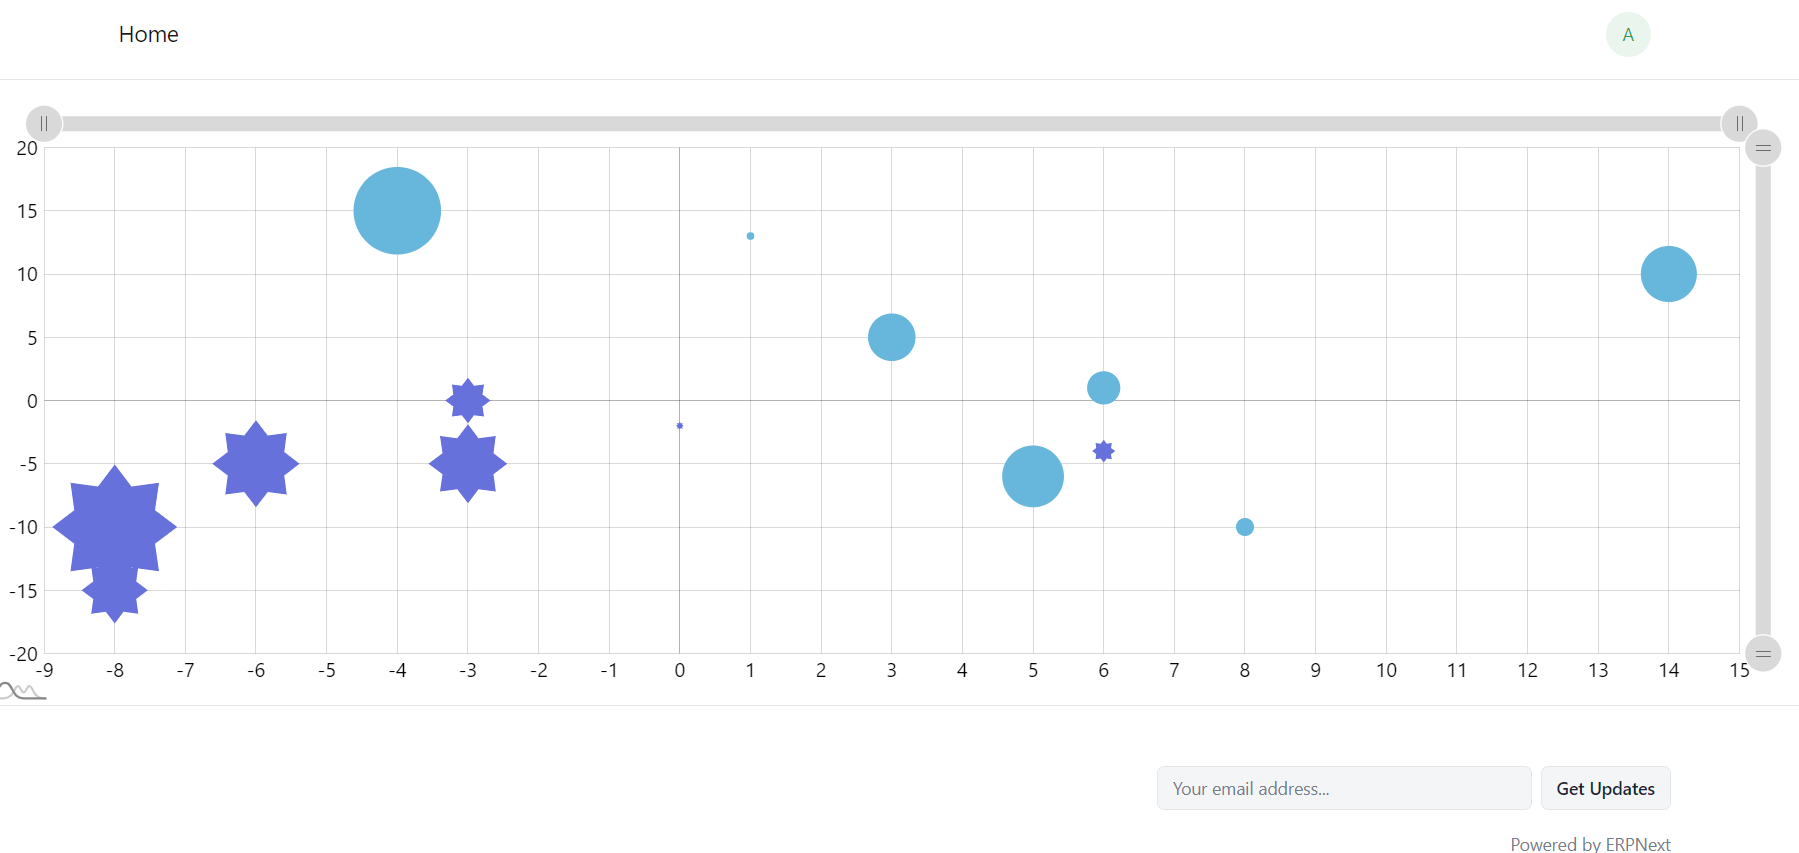
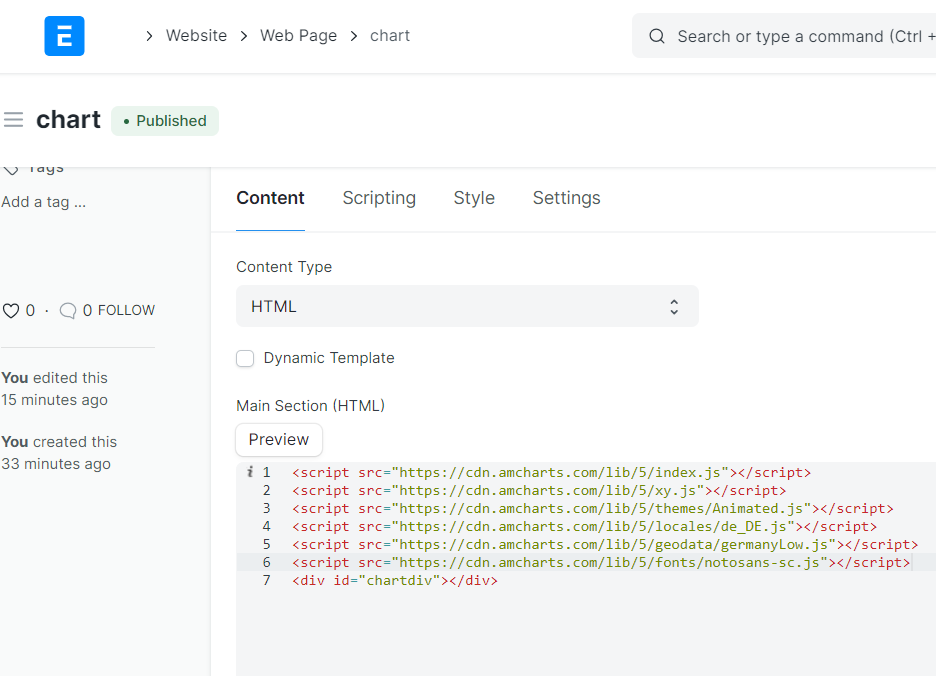
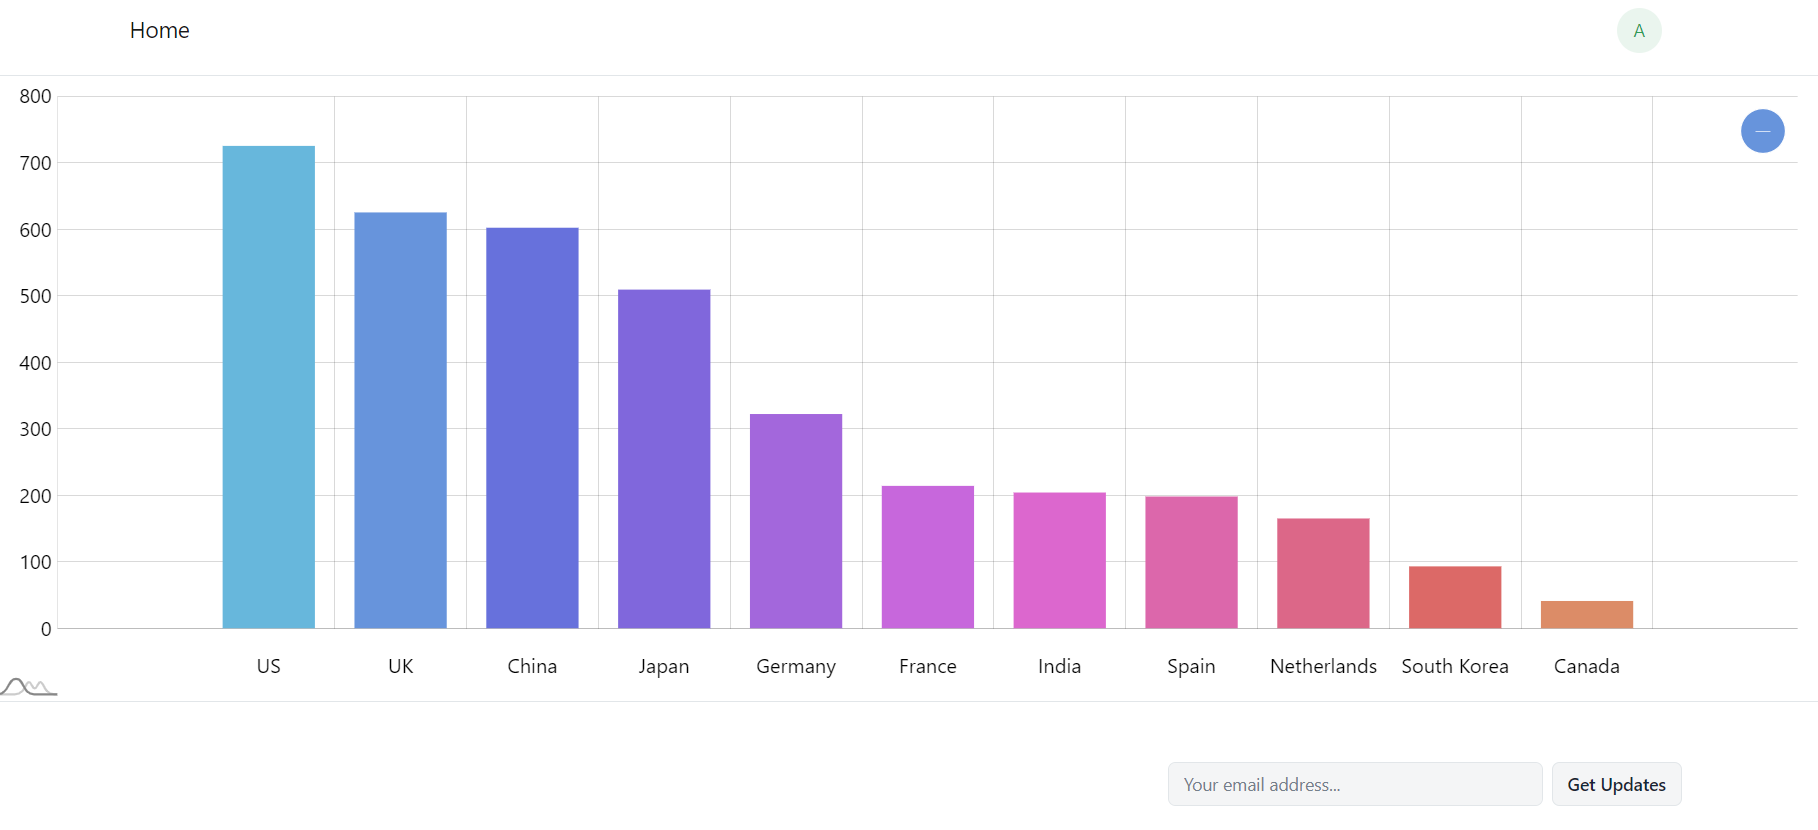
Thank you @bahaou … I tried wepage it is working fine. But not working in custom block. the same code. Below is HTML
<script src="https://cdn.amcharts.com/lib/version/5.5.7/index.js"></script>
<script src="https://cdn.amcharts.com/lib/version/5.5.7/xy.js"></script>
<script src="https://cdn.amcharts.com/lib/version/5.5.7/themes/Animated.js"></script>
<script src="https://cdn.amcharts.com/lib/version/5.5.7/locales/de_DE.js"></script>
<div id="chartdiv" style="width:50%;height:500px"></div>
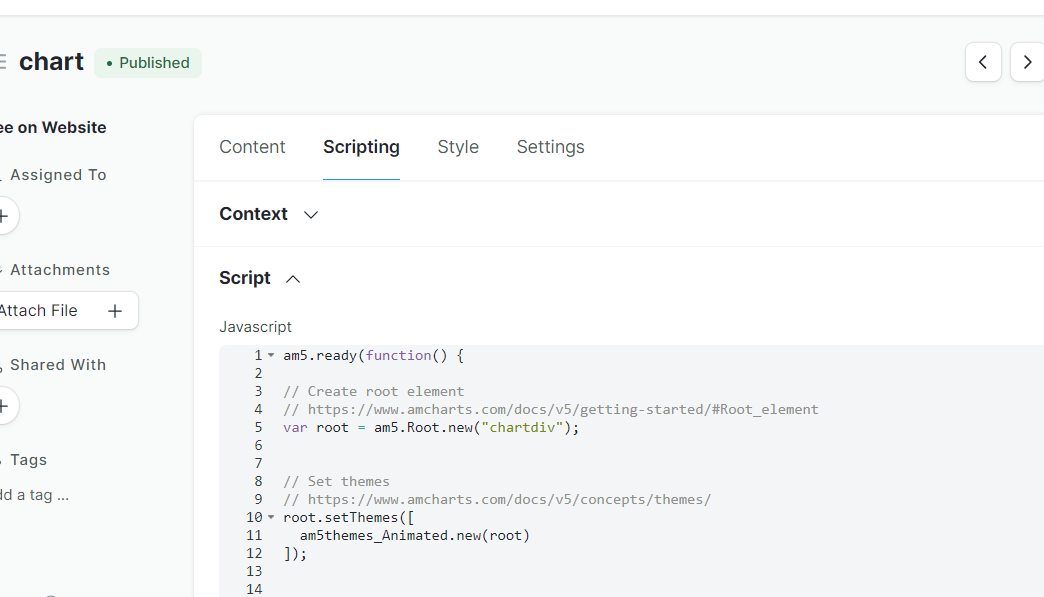
and javascript
am5.ready(function() {

// Create root element
// https://www.amcharts.com/docs/v5/getting-started/#Root_element
var root = am5.Root.new("chartdiv");

// Set themes
// https://www.amcharts.com/docs/v5/concepts/themes/
root.setThemes([
  am5themes_Animated.new(root)
]);

var data = [{
  name: "Monica",
  steps: 45688,
  pictureSettings: {
    src: "https://www.amcharts.com/wp-content/uploads/2019/04/monica.jpg"
  }
}, {
  name: "Joey",
  steps: 35781,
  pictureSettings: {
    src: "https://www.amcharts.com/wp-content/uploads/2019/04/joey.jpg"
  }
}, {
  name: "Ross",
  steps: 25464,
  pictureSettings: {
    src: "https://www.amcharts.com/wp-content/uploads/2019/04/ross.jpg"
  }
}, {
  name: "Phoebe",
  steps: 18788,
  pictureSettings: {
    src: "https://www.amcharts.com/wp-content/uploads/2019/04/phoebe.jpg"
  }
}, {
  name: "Rachel",
  steps: 15465,
  pictureSettings: {
    src: "https://www.amcharts.com/wp-content/uploads/2019/04/rachel.jpg"
  }
}, {
  name: "Chandler",
  steps: 11561,
  pictureSettings: {
    src: "https://www.amcharts.com/wp-content/uploads/2019/04/chandler.jpg"
  }
}];

// Create chart
// https://www.amcharts.com/docs/v5/charts/xy-chart/
var chart = root.container.children.push(
  am5xy.XYChart.new(root, {
    panX: false,
    panY: false,
    wheelX: "none",
    wheelY: "none",
    paddingBottom: 50,
    paddingTop: 40
  })
);

// Create axes
// https://www.amcharts.com/docs/v5/charts/xy-chart/axes/

var xRenderer = am5xy.AxisRendererX.new(root, {});
xRenderer.grid.template.set("visible", false);

var xAxis = chart.xAxes.push(
  am5xy.CategoryAxis.new(root, {
    paddingTop:40,
    categoryField: "name",
    renderer: xRenderer
  })
);


var yRenderer = am5xy.AxisRendererY.new(root, {});
yRenderer.grid.template.set("strokeDasharray", [3]);

var yAxis = chart.yAxes.push(
  am5xy.ValueAxis.new(root, {
    min: 0,
    renderer: yRenderer
  })
);

// Add series
// https://www.amcharts.com/docs/v5/charts/xy-chart/series/
var series = chart.series.push(
  am5xy.ColumnSeries.new(root, {
    name: "Income",
    xAxis: xAxis,
    yAxis: yAxis,
    valueYField: "steps",
    categoryXField: "name",
    sequencedInterpolation: true,
    calculateAggregates: true,
    maskBullets: false,
    tooltip: am5.Tooltip.new(root, {
      dy: -30,
      pointerOrientation: "vertical",
      labelText: "{valueY}"
    })
  })
);

series.columns.template.setAll({
  strokeOpacity: 0,
  cornerRadiusBR: 10,
  cornerRadiusTR: 10,
  cornerRadiusBL: 10,
  cornerRadiusTL: 10,
  maxWidth: 50,
  fillOpacity: 0.8
});

var currentlyHovered;

series.columns.template.events.on("pointerover", function (e) {
  handleHover(e.target.dataItem);
});

series.columns.template.events.on("pointerout", function (e) {
  handleOut();
});

function handleHover(dataItem) {
  if (dataItem && currentlyHovered != dataItem) {
    handleOut();
    currentlyHovered = dataItem;
    var bullet = dataItem.bullets[0];
    bullet.animate({
      key: "locationY",
      to: 1,
      duration: 600,
      easing: am5.ease.out(am5.ease.cubic)
    });
  }
}

function handleOut() {
  if (currentlyHovered) {
    var bullet = currentlyHovered.bullets[0];
    bullet.animate({
      key: "locationY",
      to: 0,
      duration: 600,
      easing: am5.ease.out(am5.ease.cubic)
    });
  }
}

var circleTemplate = am5.Template.new({});

series.bullets.push(function (root, series, dataItem) {
  var bulletContainer = am5.Container.new(root, {});
  var circle = bulletContainer.children.push(
    am5.Circle.new(
      root,
      {
        radius: 34
      },
      circleTemplate
    )
  );

  var maskCircle = bulletContainer.children.push(
    am5.Circle.new(root, { radius: 27 })
  );

  // only containers can be masked, so we add image to another container
  var imageContainer = bulletContainer.children.push(
    am5.Container.new(root, {
      mask: maskCircle
    })
  );

  var image = imageContainer.children.push(
    am5.Picture.new(root, {
      templateField: "pictureSettings",
      centerX: am5.p50,
      centerY: am5.p50,
      width: 60,
      height: 60
    })
  );

  return am5.Bullet.new(root, {
    locationY: 0,
    sprite: bulletContainer
  });
});

// heatrule
series.set("heatRules", [
  {
    dataField: "valueY",
    min: am5.color(0xe5dc36),
    max: am5.color(0x5faa46),
    target: series.columns.template,
    key: "fill"
  },
  {
    dataField: "valueY",
    min: am5.color(0xe5dc36),
    max: am5.color(0x5faa46),
    target: circleTemplate,
    key: "fill"
  }
]);

series.data.setAll(data);
xAxis.data.setAll(data);

var cursor = chart.set("cursor", am5xy.XYCursor.new(root, {}));
cursor.lineX.set("visible", false);
cursor.lineY.set("visible", false);

cursor.events.on("cursormoved", function () {
  var dataItem = series.get("tooltip").dataItem;
  if (dataItem) {
    handleHover(dataItem);
  } else {
    handleOut();
  }
});

// Make stuff animate on load
// https://www.amcharts.com/docs/v5/concepts/animations/
series.appear();
chart.appear(1000, 100);

}); // end am5.ready()
It is giving empty blog. no chart in dashboard. can you pls guide me where i am wrong…