if the preoficiency_level (star) greater than or equal to 3 star it will be green or else Orange
frappe.query_reports["Employee Skill Report"] = {
	"filters": [
		{
			"fieldname": "branch",
			"label": __("Select Branch"),
			"fieldtype": "Link",
			"options": "Branch"
		},
		{
			"fieldname":"project_manager",
			"label": __("Project Manager"),
			"fieldtype": "Link",
			"options":"User",
			"get_query": function () {
						return {
							query: "ss_custom_erpnext.ss_custom_erpnext.constant.constant.get_project_manager_list"
						}
			}
		},
	],
	"formatter": function (value, row, column, data, default_formatter) {
		value = default_formatter(value, row, column, data);
		let star = ['***','****','*****']
		if (column.id == "technology"){
			if(star.includes(data["proficiency_level"])){
				value = `<span style='color:green';>${data['technology']} </span>`;
			}
			else{
				value = `<span style='color:#ff8c00';>${data['technology']} </span>`;
			}
		}else if (column.id == "employee"){
			if (data['employee'].includes("(hide)")){
				return value = ''
			}else{
				return value = data['employee']
			}
		}else if (column.id == "employee_name"){
			if (data['employee_name'].includes("(hide)")){
				return value = ''
			}else{
				return value = data['employee_name']
			}
		}else if (column.id == "team_lead"){
			if (data['team_lead'].includes("(hide)")){
				return value = ''
			}else{
				return value = data['team_lead']
			}
		}else if (column.id == "date_of_joining"){
			if (data['date_of_joining'].includes("(hide)")){
				return value = ''
			}else{
				return value = data['date_of_joining']
			}
		}
        return value;
        },

};
1 Like
bahaou
April 29, 2022, 10:04am
2
@Antony_Praveenkumar a nice trick I ve been doing . if the columns is not a LINK . I just add a html code to the data like
<span style="color:#548765"> value</span>
and voila you get any color you want . you can add also small images , icons . and they will look great.
1 Like
@bahaou can you please share the screen shoot of your report
bahaou
April 29, 2022, 10:12am
4
this one has small images I added them to the country doctype .
6 Likes
bahaou
April 29, 2022, 10:17am
6
it works also with charts . see those colors are not standard . also the box when you scroll the mouse on top of the chart has little icons
1 Like
it’s really nice man, can i get the code for that report @bahaou
Hetvi
November 30, 2023, 1:28pm
8
Do you have any hack to add decent size images in report?
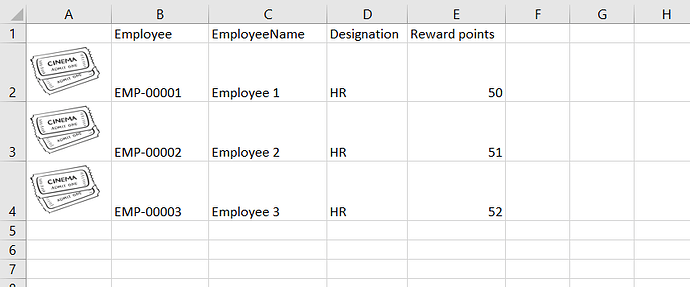
We can use SVG Format Icons or Images. for handling the images is not that much easy but can share any screenshot or sample image how you want. like create a sample using the excel and share here.
Hetvi
December 2, 2023, 9:26am
10
Hi, Thankyou for replying. This is something which I am trying to achieve. I did try using html and the image was actually printing but the height of columns is fixed I believe.
inject some css through Jquery
$("your-class").css({object-fit: "contain"})
2 Likes
Hetvi
December 5, 2023, 10:53am
12
Can you give me an example or where to insert it? I am new to this thing.
insert in the report js file
Hetvi
December 5, 2023, 11:05am
14
def execute(filters=None):
data = frappe.db.sql("""select CONCAT("<img src=",`tabEmployee`.image," height=30 width=30",">") as "Images",employee_name from tabEmployee """)
return columns, data
What should I include in js in reflection if this?
1 Like


