Hello Guys,
Hope you can help me.
I just want to know, How I can possible to maintain ERP Next Performance to highest level.
It takes a minute able to sign-in users account.
Thanks.
@Foxdemon96
Hello Guys,
Hope you can help me.
I just want to know, How I can possible to maintain ERP Next Performance to highest level.
It takes a minute able to sign-in users account.
Thanks.
@Foxdemon96
What are the specs of the server you are running ERPNext on?
Hi @chabad360,
Server running under DigitalOcean
16GB Memory
8 vCPUs
100 SSD DISK
Thanks,
@Foxdemon96
Checkout
for specs like that, I’m wondering what is going on there… Are you running anything else on that VPS?
Hello @yashodhan,
I already using htop for the monitoring.
but I’m still unsure how to fully used it then. Any recommendation how I can fully used it.
Thanks.
@Foxdemon96
Hello @chabad360,
yeah, that’s why I’m also wondering .
it takes 20-30 seconds able to login.
for the VPS, No.
I’m Using To many Process flow (Workflow).
Thanks.
@Foxdemon96
I don’t know how many sites and users you are running on that machine, but I try to provide you a very generic list of main optimizations:
If budget is not an issue, for that configuration, I would pass to AWS, much more options and features (Amazon RDS, EFS, Load Balancer, Cloud Front and so on).
Hello @fromthestone,
Thank you so much for your suggestion regarding my concern.
I will try to explore more and more, for me better to understand.
Thanks.
@Foxdemon96
@Foxdemon96,
Taking a minute to login is just sad… there is something very wrong.
If you are running v12 then there is a tool built into the framework just for cases like this.
Log in as administrator and go to [yourerpnexturl]/desk#recorder .
This tool records every request and their response time. And, also every query that was executed during the processing of that request.
Open that page, hit record and ask a user to login and see which exact request is taking you that long. and do post your findings here.
Hello one aspect that affects erpnext performance is the innodb_buffer_pool_size, and I’ve learnt this the hard way.
Can you can check your my.cnf and see what is the current value ? It can be found in /etc/mysql/
Okay the default value isn’t enough. I tried like this from https://dba.stackexchange.com/a/27341:
Start mysql as root
mysql -u root -p
Then execute this query:
SELECT CONCAT(CEILING(RIBPS/POWER(1024,pw)),SUBSTR(' KMGT',pw+1,1))
Recommended_InnoDB_Buffer_Pool_Size FROM
(
    SELECT RIBPS,FLOOR(LOG(RIBPS)/LOG(1024)) pw
    FROM
    (
        SELECT SUM(data_length+index_length)*1.1*growth RIBPS
        FROM information_schema.tables AAA,
        (SELECT 1.25 growth) BBB
        WHERE ENGINE='InnoDB'
    ) AA
) A;
This will show you recommended size for innodb_buffer_pool_size. G for Gigabytes and M for Megabytes
Now, before making any changes please take a backup of your my.cnf file.
Then copy and paste this at the bottom of your my.cnf or include these in the existing mysqld section that is mentioned at the bottom:
[mysqld]
innodb_buffer_pool_size=SIZE
innodb_buffer_pool_instances=NUMBER
Replace the pool size value by the recommended value from the query. If the recommended pool size is higher than or equal to 2G, select an adequate value for innodb_buffer_pool_instances such that each pool size is atleast 1G.
Then restart your mariadb service.
The above pool memory will be reserved from RAM as far as i know. Hence please take care that you don’t allow too much of RAM to be used for database.
Again, there surely are other ways to improve performance, but I know this one. Please remember this value will need to be updated when your database grows. Once set, this should reduce the Disk I/O.
I think your my.cnf settings are far to low for good performance.
However, not all performance issues are related to mariadb. Sometimes it is the fault of the cloud service provider. You can get a feel for the performance of the physical server where your instance is hosted by running the following command:
wget -qO- bench.sh | bash
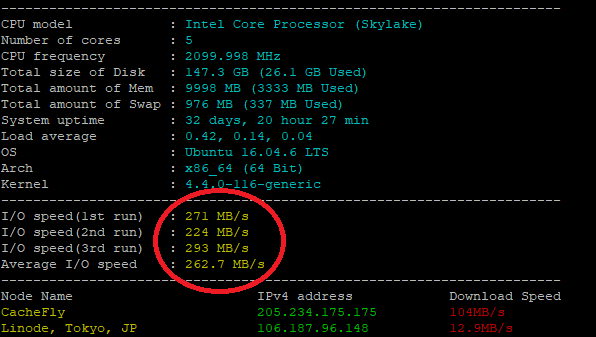
You should get a response that looks similar to this:

I circled in red the numbers that you need to be most concerned about. This is an indication of how your interaction with the physical server is performing. To give you some idea of what that means, consider the following:
The above server with an average I/O speed of 262.7MB/s will respond to a erpnext login request in about 3 to 4 seconds,
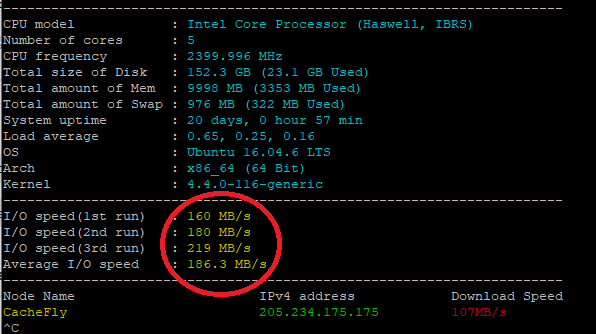
The exact same database and configuration on another set of similar hardware can still look very different. For example, this is another one of my servers that I only use as a training tool:

Notice the numbers here are almost half of the previous server. The time to login to ERPNext on this server is about 12 to 15 seconds. The lower numbers means the physical server is being shared by other virtual servers or droplets that you cannot see and each of them are taking up some of the available I/O throughput.
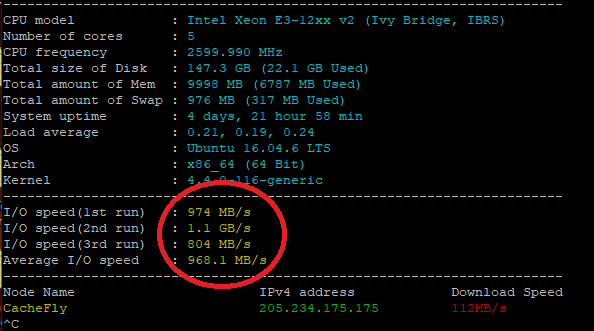
Here is another example of the exact same server configuration and the exact same database on yet another set of similar hardware:

Notice the huge difference in the performance numbers?
The ERPNext login time on this server is almost instantaneous!
All three of the examples above are from a single client. I keep 3 servers running all the time for each client using my Poor Mans Backup System just in case I have to move them to hardware in a different city due to some unforeseen internet outage.
I have other examples of 3 servers in the same building giving a similar wide range of performance results and it is all due to what other virtual hosts are being shared on the same hardware.
Oh… and the database size on these three servers is 2.4GB, so size can be big or small and still perform well if the database is tuned properly and the server has a high I/O throughput.
As another indicator of speed…
I restore the primary database (2.4GB) to all three of these servers every Sunday night:
Just try running the command that will give you the same display I presented above and you can get a feel for how your server is performing. If you made the MariaDB adjustments and didn’t get a satisfactory result, then look at the server performance and if needed contact your service provider to ask them to move your server to a different node that performs better.
BKM
Good info many thanks BKM,
This is terrific food for discovery and thought!
On my localhost VM instance, my I/O speed is 10-70x higher than yours. However my download speed is 30x lower than your say 100+MB/s values.
Perhaps the latter needs attention in my case…
edit: I figure MB/s versus Mbps rates differ by a factor of 8 (ie 8 bits to a byte). So then my 28Mbps download result value from https://teksavvy.speedtest.net matches well with my 3.2 MB/s value reported from your test.
Wow, I envy your service. The server hardware I/O speeds that I circled in my examples are just the I/O taking place at the processor point in the cloud.
The DOWNLOAD speeds listed in the section below the I/O speeds in my examples are also a good indicator of how well the host location can connect to other places around the world. It serves as a good indicator as to how well your site can be accessed in other parts of the world in case you need to improve the experience for a part of your user group.
Your download speed locally really only impacts your experience. The best way to see how the impact is at other locations is to use a test that can run the download diagnostic to other parts of the country or the world. That is another one of the values of the test I use.
But, as always, Your mileage may vary! ![]()
BKM
This curl tool measures and reports the ‘time to first byte’ and other request and response timings.
Here’s an example report (values are in seconds)
[clarkej@tango ~]$ curl -w “@curl-format.txt” -o /dev/null -s “http://google.com/”
time_namelookup: 0.029
time_connect: 0.052
time_appconnect: 0.000
time_pretransfer: 0.052
time_redirect: 0.000
time_starttransfer: 0.089
———
time_total: 0.090
edit: If not the expected output, try singles quotes for example:
curl -w ‘@curl-format.txt’ -o /dev/null -s ‘http://google.com/’